Distributed tracing was built to answer a specific question: where did the request go, and how long did each hop take? For request/response systems, that question is sufficient. A span with a 200 status and normal latency means the system did its job.
For MCP-based agents, that question is no longer sufficient — and most of the tracing we're bolting onto agentic systems right now still only answers it. This post walks through why, and then through a small, runnable reference implementation that closes part of the gap using tooling the ecosystem already has.
The gap: every span can be green and the decision can still be wrong
Consider a typical MCP tool-call trace: an agent calls a search_claims tool, gets a result back in 340ms, calls check_eligibility, gets a result back in 190ms, then produces a final answer. Every span completes. No errors. No retries. No latency anomaly. From the tracing dashboard's point of view, this execution is indistinguishable from a correct one.
But the agent can still have reasoned poorly over what those tools returned — anchored on stale data from the first tool call, ignored a contradiction the second tool call introduced, or generalized past the edge of what the retrieved context actually supported. None of that shows up as a span attribute. The failure is semantic, not operational, and classical distributed tracing has no vocabulary for it.
This isn't a criticism of tracing infrastructure — it's doing exactly what it was designed to do. It's an observation that the question changes once the system under observation starts making decisions instead of just moving data.
What changes with the MCP tracing work
The MCP spec's distributed tracing support is real infrastructure for this: trace context can propagate cleanly across tool calls, server hops, and multi-agent handoffs instead of being stitched together after the fact by whatever logging each server happened to implement. That's a genuine unlock — before this, correlating a reasoning trace across three MCP servers meant reconstructing it from timestamps and hope.
But protocol-level trace propagation solves the plumbing problem, not the semantics problem. Having a clean, correlated trace across every tool call in an agent's execution is necessary. It's not sufficient. The question worth asking as the ecosystem builds out tracing support: what do we actually put in the spans?
A pattern: attach calibration signals to spans, not just outcomes
The pattern I've found useful is to treat each tool-call span as an opportunity to record not just what happened but how much the agent's downstream reasoning should be trusted given what happened.
Concretely, that means enriching spans with attributes like:
- Context completeness — did the tool result actually contain what the next reasoning step needed, or is the agent extrapolating past it?
- Currency — how stale is the underlying data relative to when a decision is being made on it?
- Contradiction flags — does this tool result conflict with something earlier in the trace that the agent hasn't reconciled?
None of these are exotic. They're closer to lightweight, rule-based checks than model calls — which matters, because if your observability layer costs as much as the agent it's watching, nobody will run it in production.
This is where the Common Expression Language (CEL) is a genuinely good fit, and it's the same rule language exposed by ecosystem projects like agentgateway. CEL policies are cheap to evaluate, easy to audit, and — crucially — they can sit at the same boundary where you'd want to act on a bad signal, not just log it. A policy that tags a span low-confidence and a policy that blocks the next tool call from firing can be the same rule, evaluated at the same place. That collapses observability and enforcement into one layer instead of two systems that drift out of sync with each other, which is usually where "we had a monitor for this" turns into "the monitor didn't stop it."
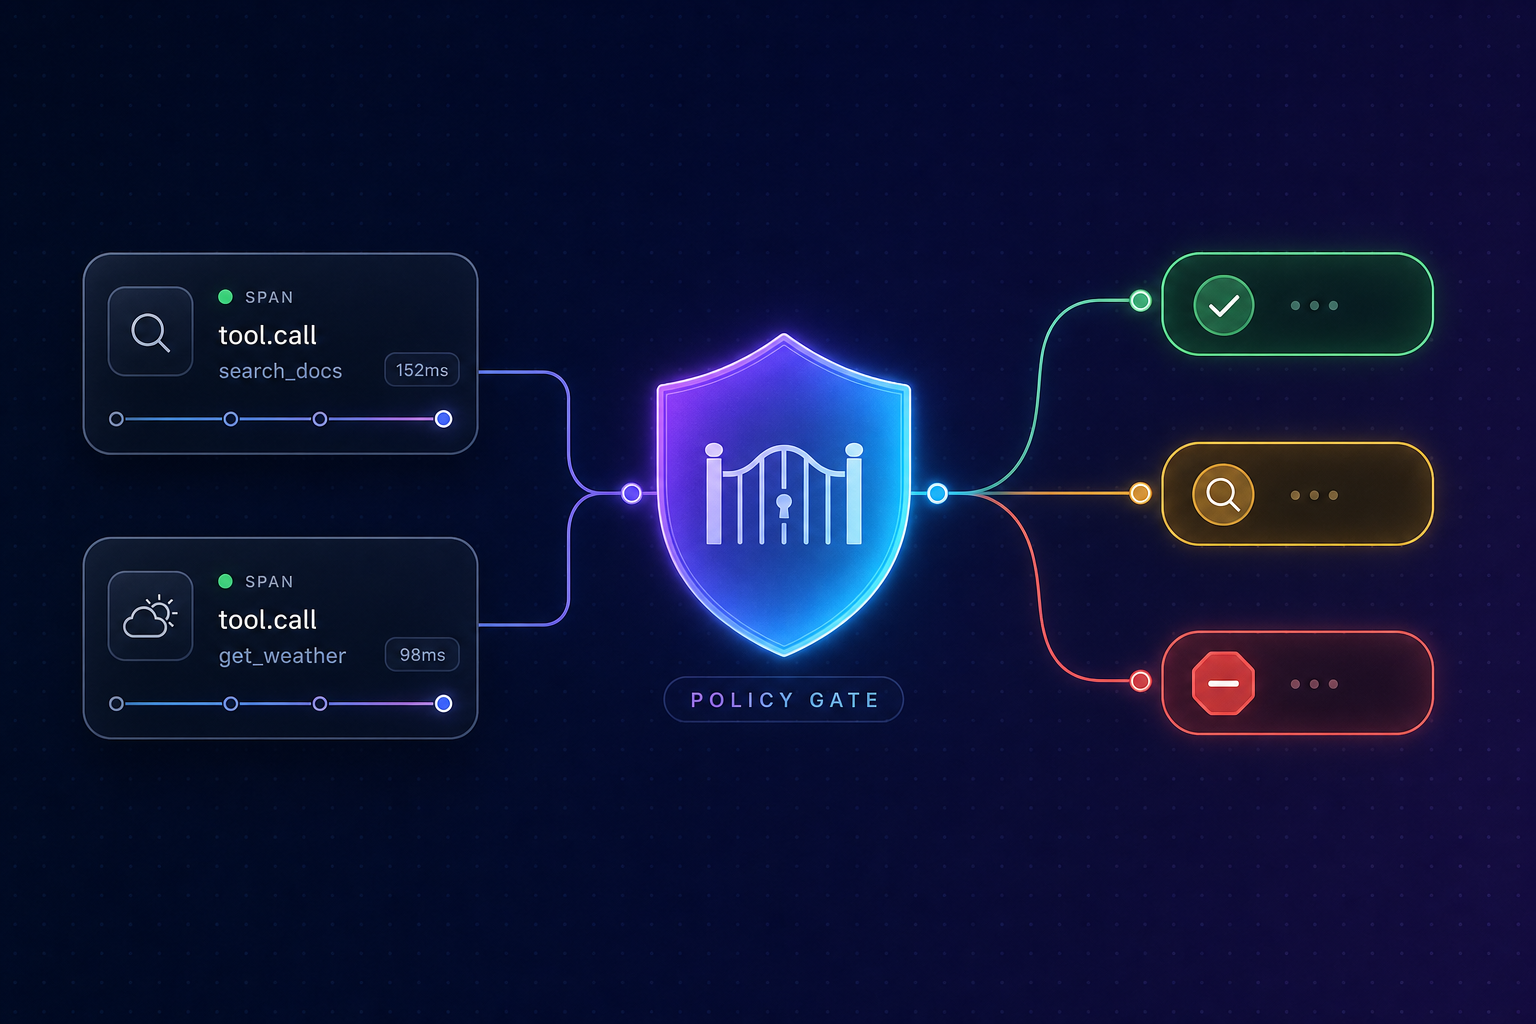
A three-tier response to that signal is the simplest version that's actually useful:
- Auto-proceed — signal is clean, no intervention.
- Flag for review — signal is degraded but not disqualifying; surface it to a human or a slower verification path.
- Block — signal fails a hard threshold; the tool-authorization boundary is the right place to physically stop the call, not just annotate it after the fact.
That third tier is worth being precise about. The honest claim is narrow: gating at the MCP tool-authorization boundary is where enforcement can be physically real — the call either fires or it doesn't. Everything upstream of that (the confidence scoring itself) is a design choice you have to validate for your own domain; it isn't something the protocol gives you for free, and it shouldn't be oversold as such.
From pattern to runnable code
To make the pattern concrete rather than hand-wavy, I built a small reference implementation: mcp-trace-gate. It has no API keys, no network calls, and no model in the loop — every tool result is a mock, so the whole thing runs offline in well under a second. The point is the architecture, not the model.
The core data model is a normal trace span with a calibration attachment. Standard fields (status, duration, IDs) plus three cheap scores:
@dataclass
class CalibrationScores:
    completeness: float  # did the tool result contain what the next step needs?
    currency: float      # how fresh is the underlying data (1.0 = current)?
    contradiction: bool  # does this conflict with an earlier span in the trace?
The scoring functions are deliberately simple — field-presence checks, linear decay, and raw equality — so the demo has essentially zero dependencies and is easy to read:
def score_completeness(result: ToolResult) -> float:
    """Fraction of requested fields the tool result actually returned."""
    if not result.fields_requested:
        return 1.0
    present = set(result.fields_present)
    requested = set(result.fields_requested)
    return round(len(present & requested) / len(requested), 3)

def score_currency(result: ToolResult) -> float:
    """1.0 = fresh; decays linearly to 0 once age exceeds the freshness horizon."""
    if result.freshness_horizon_days <= 0:
        return 1.0
    ratio = 1.0 - (result.data_age_days / result.freshness_horizon_days)
    return round(max(0.0, min(1.0, ratio)), 3)

def score_contradiction(result: ToolResult, prior_results: list[ToolResult]) -> bool:
    """Flags if a later result overwrites a shared field from an earlier span
    with a materially different value."""
    for prior in prior_results:
        for key in set(prior.data) & set(result.data):
            if prior.data[key] != result.data[key]:
                return True
    return False
The gating rules live in plain .cel files, not in Python. That's the deliberate part: the artifact that scores a span and the artifact that would gate the underlying tool call in a gateway deployment are the same file, so they can't drift apart into two systems.
# policies/block.cel
contradiction == true || completeness < 0.4

# policies/review.cel
completeness < 0.75 || currency < 0.6
The gate compiles those expressions once and evaluates them per span, checking block before review so the hard stop always wins:
def evaluate(self, scores: CalibrationScores) -> str:
    activation = self._to_cel_activation(scores)
    if bool(self.block_rule.evaluate(activation)):
        return TIER_BLOCK
    if bool(self.review_rule.evaluate(activation)):
        return TIER_REVIEW
    return TIER_AUTO_PROCEED
And the agent loop treats the gate's tier as part of whether the call succeeded, not something checked after the fact. The moment a span is blocked, the loop stops instead of reasoning forward:
for tool_fn in TOOL_SEQUENCE:
    result = tool_fn(scenario)
    scores = score_tool_result(result, prior_results)
    tier = gate.evaluate(scores)
    # ... record span ...
    if tier == TIER_BLOCK:
        return TraceResult(scenario, spans, outcome="blocked", blocked_at=result.tool_name)
What the three scenarios show
Every scenario is printed twice, on purpose — the distributed-trace view an APM would show, and the calibration view this layer adds. The trace view reads HEALTHY for all three, including the one that's actually broken:
Distributed trace view (what your APM shows)
Calibration view (what this layer adds)
contradiction scenario.=== scenario: contradiction (trace_id=trace-contradiction) ===
distributed trace view (what your APM shows):
search_claims status=ok duration= 42.0ms error=none
check_eligibility status=ok duration= 58.0ms error=none
calibration view (what this layer adds):
[PASS ] search_claims completeness=1.0 currency=0.933 contradiction=False (+0.15ms)
[BLOCK] check_eligibility completeness=1.0 currency=0.929 contradiction=True (+0.07ms)
-> trace halted at tool-authorization boundary: check_eligibility
verdict: trace says HEALTHY | calibration says BLOCKED- clean — both tool calls return complete, fresh, non-conflicting data. Both spans auto-proceed and the trace completes.
- stale — the first call is missing a requested field (
adjudication_date) and its data has aged past the freshness horizon, so completeness drops to0.667and currency to0.0. That trips the review rule. It's flagged, but review isn't a hard stop, so the trace still completes. - contradiction — this is the one the pattern exists for. The second tool call agrees with the first on
member_idbut reportsclaim_status="denied"where the first reported"approved"— a downstream system that hasn't caught up with a reversal. Nothing here raised an exception. No latency was abnormal. Both calls returned well-formed data. A standard trace looks completely healthy. The block only happens because the calibration layer is explicitly checking whether the two results agree with each other — and because the block is enforced at the tool-authorization boundary, the agent never gets to reason over the conflict.
| Scenario | Trace view | Calibration verdict | What happens |
|---|---|---|---|
clean | HEALTHY | CLEAR | Both spans auto-proceed; the trace completes. |
stale | HEALTHY | NEEDS REVIEW | First span flagged for review; the trace still completes. |
contradiction | HEALTHY | BLOCKED | Halted at the tool-authorization boundary before the agent reasons further. |
The whole thing is covered by 24 unit tests (python -m pytest) exercising the scoring functions, the CEL gate, and the end-to-end agent loop, including that the contradiction scenario short-circuits after exactly two spans.
What this deliberately isn't
This is a pattern demo, not a production system, and it's worth being blunt about the edges:
- The scoring is intentionally naive. Real contradiction detection needs domain-aware entailment, not raw equality — two results can disagree in ways string comparison misses, and agree in ways it flags falsely. That work is genuinely domain-specific and this repo doesn't try to solve it generically.
- "Block enforced at the tool-authorization boundary" describes where enforcement can be physically real in an MCP deployment. Whether a given production system actually wires the gate in at that boundary is a deployment decision, not something a demo can claim on anyone's behalf.
- One practical note if you clone it:
cel-pythonrequires Python 3.10+, so use a recent interpreter.
The value isn't in the specific thresholds. It's in the shape: cheap scores on every span, expressed as portable CEL, evaluated at the point where you can still choose not to act.
Why this matters more as agents get less linear
The failure mode that motivates all of this isn't the agent that's obviously broken — those get caught by ordinary error handling. It's the agent that hits a contradictory tool result mid-trace and confabulates forward instead of revising: commits to an earlier read of the situation and keeps building on it, producing a confident, well-formed, wrong final answer. Standard tracing sees a healthy execution. Nothing pages anyone. The gap only shows up later, when someone downstream has to explain why the decision doesn't hold up.
As MCP agents move toward more distributed, multi-hop patterns — routing across servers, protocol-layer caching, custom extensions — the number of places a trace can look clean while the reasoning quietly drifts only grows. Trace propagation gives us the wiring to catch this. It doesn't give us the judgment. That part still has to be designed in, deliberately, at the boundary where the agent is about to act.
Takeaways and what's next
If you're instrumenting MCP agents, three things are worth taking away:
- A green span is an operational signal, not a semantic one. Treat "the call succeeded" and "the result is trustworthy to reason over" as two different questions.
- Keep the confidence signals cheap. Field-presence, freshness decay, and cross-span consistency checks cost almost nothing and catch a real class of failures. Save the expensive checks for the cases the cheap ones flag.
- Put the rule where you can act on it. Expressing gating logic as CEL means the same audited artifact can both annotate a span and stop a tool call, at the same boundary — one layer instead of two that drift.
The open questions worth working through as a community are which signals are cheap enough to compute at every span without becoming their own bottleneck, and how much of this can standardize as a shared MCP tracing convention versus staying implementation-specific per deployment. This is a starting pattern, not a finished one, and it fits squarely in the interoperability-and-open-standards work AAIF exists to advance.
The full reference implementation — source, CEL policies, tests, and sample trace output — is available at mcp-trace-gate; fork it and adapt the scoring functions to your own domain.