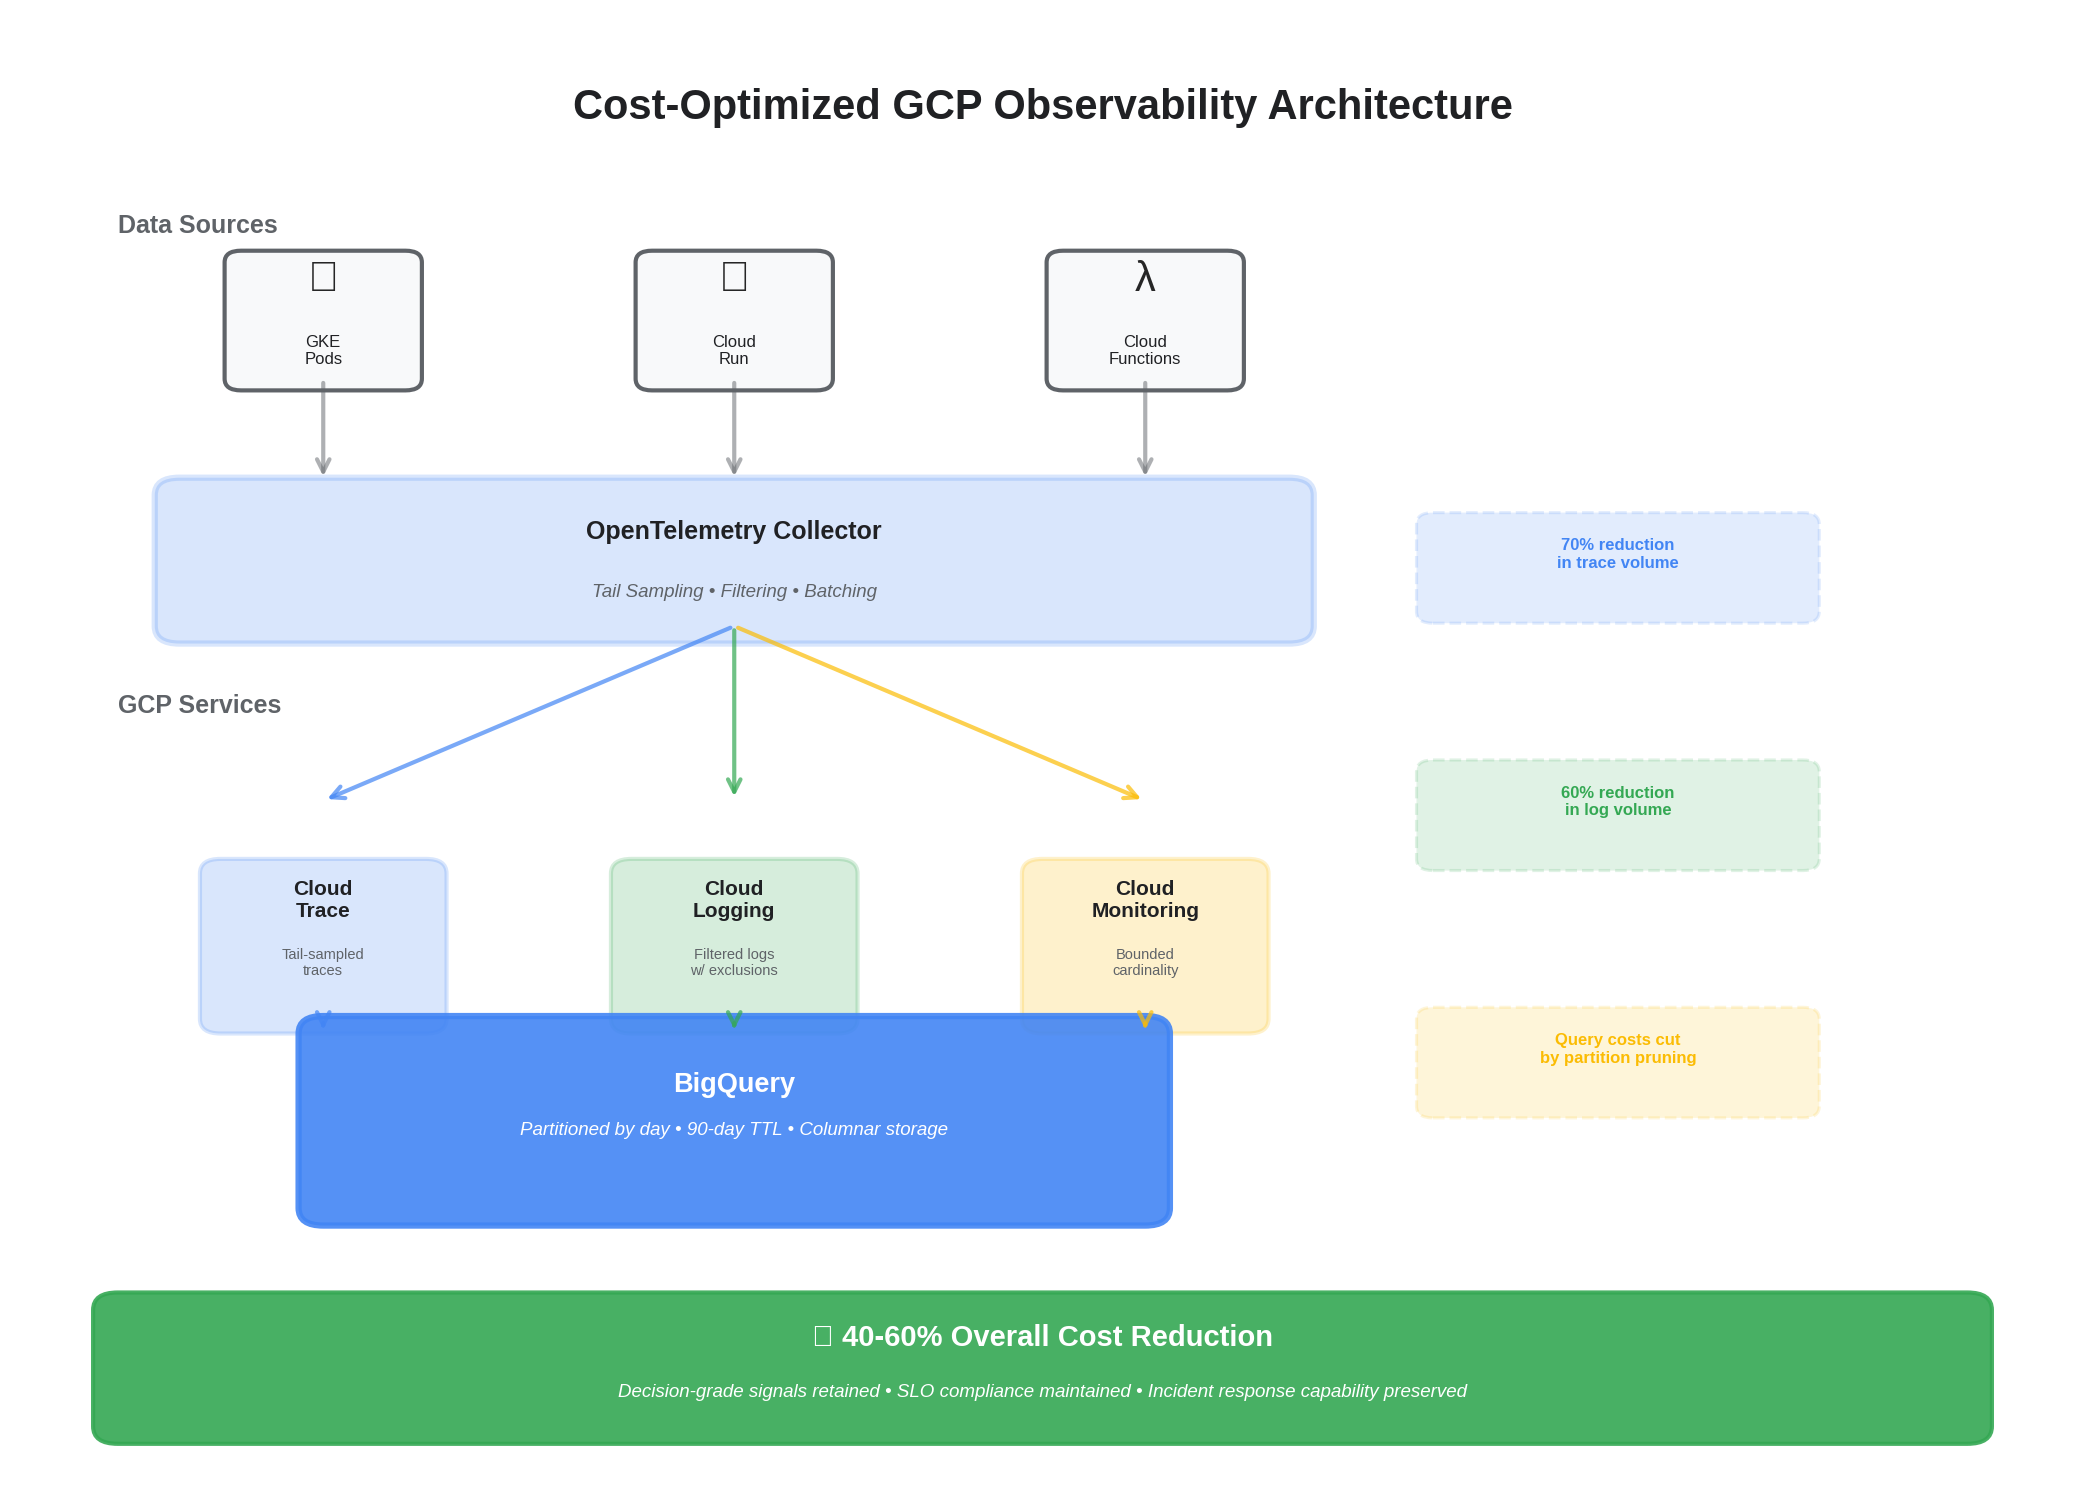
An SRE‑driven approach to reduce telemetry spend while protecting decision‑grade signal. This playbook combines OpenTelemetry sampling, value‑based retention, and native GCP levers (Logging exclusions, BigQuery partitioning/TTL, Monitoring cardinality controls).
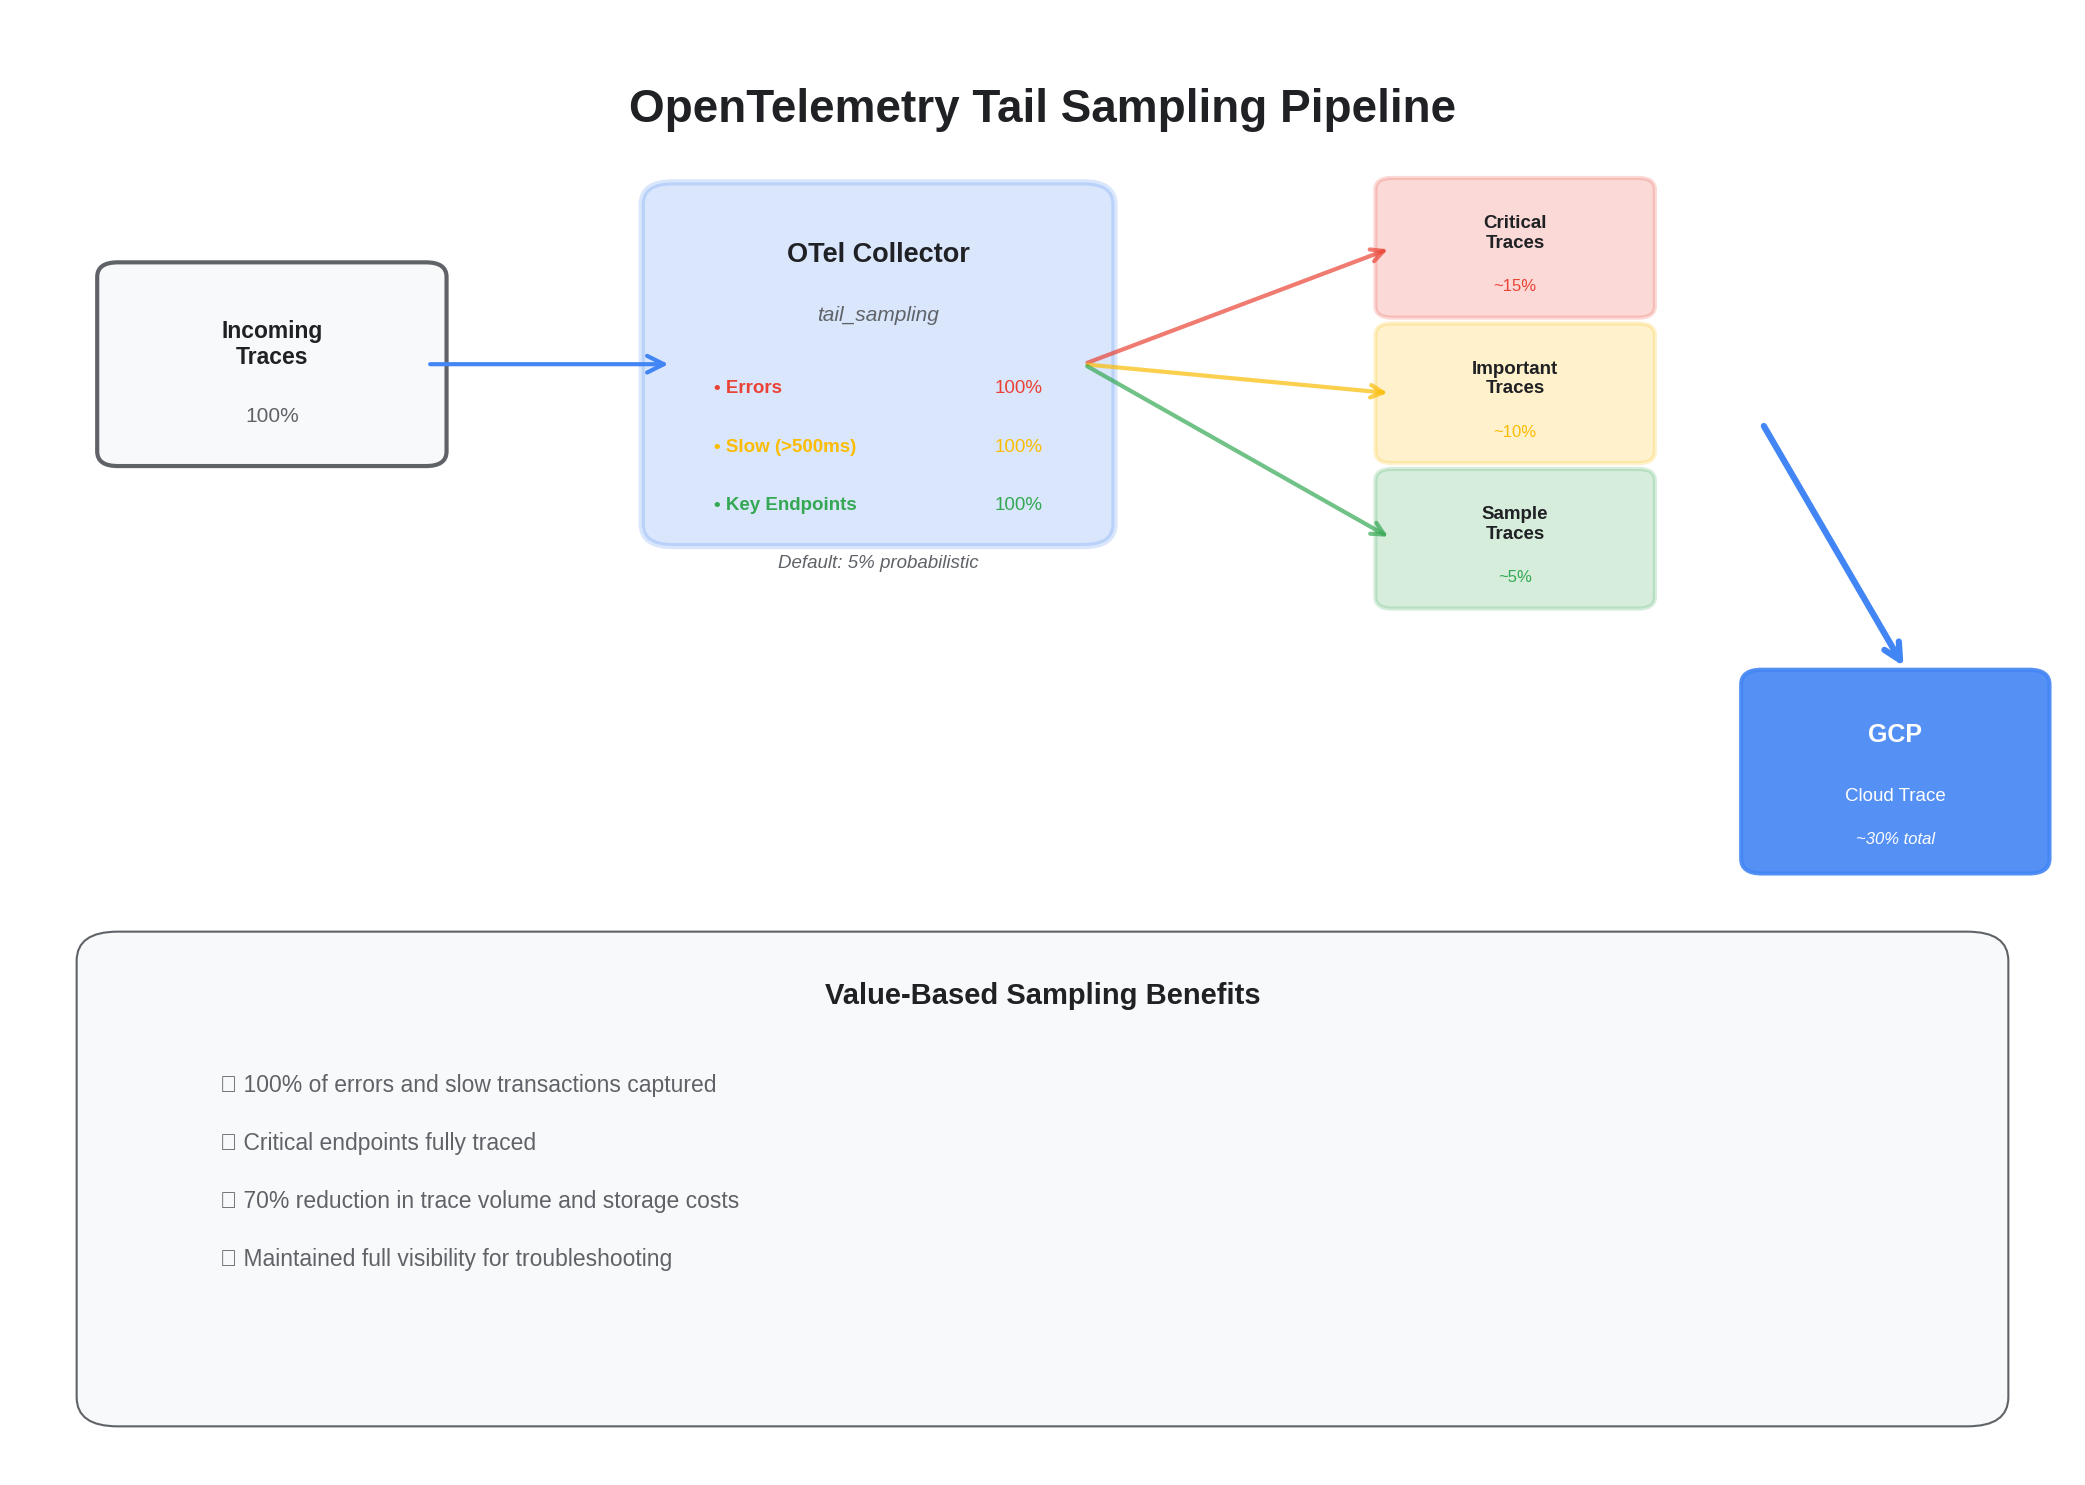
1) Value‑based sampling in OTel Collector
processors:
  tail_sampling:
    decision_wait: 5s
    policies:
      - name: errors-and-slow
        type: status_code
        status_code:
          status_codes: [ERROR]
      - name: latency
        type: latency
        latency:
          threshold_ms: 500
      - name: key-endpoints
        type: string_attribute
        string_attribute:
          key: http.target
          values: ["/checkout","/payment","/login"]
      - name: default-probabilistic
        type: probabilistic
        probabilistic:
          sampling_percentage: 5

service:
  pipelines:
    traces:
      processors: [memory_limiter, resourcedetection, tail_sampling, batch]
2) GCP Logging: exclude noise at the sink
resource "google_logging_project_sink" "app_sink" {
  name        = "logs-to-bq"
  destination = "bigquery.googleapis.com/projects/${var.project_id}/datasets/observability"
  filter      = <<EOF
resource.type=("k8s_container" OR "cloud_run_revision")
severity>=DEFAULT
-jsonPayload.debug
-textPayload:("healthz" OR "readiness" OR "liveness")
EOF
  unique_writer_identity = true
}
3) BigQuery: partitioning and TTL
resource "google_bigquery_dataset" "obs" {
  dataset_id = "observability"
  location   = var.region
}

resource "google_bigquery_table" "traces" {
  dataset_id          = google_bigquery_dataset.obs.dataset_id
  table_id            = "traces"
  time_partitioning {
    type  = "DAY"
    field = "receiveTimestamp"
  }
  deletion_protection = false
  labels = { purpose = "observability" }
}

resource "google_bigquery_table_iam_member" "ro" {
  dataset_id = google_bigquery_dataset.obs.dataset_id
  table_id   = google_bigquery_table.traces.table_id
  role       = "roles/bigquery.dataViewer"
  member     = "group:analytics@example.com"
}
4) Monitoring: cardinality guardrails
- Prefer bounded labels (status_code_class vs full status_code)
- Drop high‑entropy IDs from metrics (user_id, request_id)
- Record exemplars in traces instead of exploding metric series
5) Metric Aggregation: Pre-Aggregate at the Collector
High-cardinality metrics are the silent budget killer on GCP Monitoring. A single metric with user_id as a label can generate millions of time series. The OTel Collector can aggregate before export:
processors:
  metricstransform:
    transforms:
      - include: http_request_duration
        action: update
        operations:
          - action: aggregate_labels
            label_set: [method, status_class, service]
            aggregation_type: sum
This collapses high-cardinality labels (like full URL paths) into bounded sets (method + status class) before the data ever leaves the collector. The raw high-cardinality data is still available in traces via exemplars — you just don't pay to store it as metric series.
6) Retention Tiers: Match Cost to Value
Not all telemetry data has the same shelf life. We use a three-tier retention strategy:
- Hot tier (7 days) — Full-resolution traces, all logs at severity ≥ WARNING. Used for active incident investigation. Stored in Cloud Trace and Cloud Logging with default retention.
- Warm tier (30 days) — Aggregated metrics, sampled traces (errors + high latency only), structured logs in BigQuery with day partitioning. Used for trend analysis and SLO reporting.
- Cold tier (90+ days) — Metrics summaries exported to Cloud Storage in Parquet format. Used for capacity planning and quarterly reviews. Costs pennies per GB.
The key insight: most telemetry data is only valuable in the first 72 hours. Keeping 100% of traces for 90 days is paying hot-tier prices for cold-tier utility.
7) Cost Model: Before and After
Here's a representative cost breakdown for a platform processing ~50K requests/minute across 12 services on GCP:
| Category | Before | After | Reduction |
|---|---|---|---|
| Cloud Logging ingestion | $2,400/mo | $720/mo | 70% |
| Cloud Trace spans | $1,800/mo | $540/mo | 70% |
| Cloud Monitoring metrics | $900/mo | $450/mo | 50% |
| BigQuery storage/query | $600/mo | $300/mo | 50% |
| Total | $5,700/mo | $2,010/mo | 65% |
What We Didn't Sacrifice
Cost optimization is only valuable if you keep the signals that matter. After applying all optimizations, we verified:
- 100% of error traces retained — Every 5xx, timeout, and exception is captured with full context
- 100% of SLO-relevant metrics retained — Availability, latency percentiles, and error rates at the service level
- P95 latency traces retained — Tail latency investigation is possible for any service
- Alert fidelity unchanged — No increase in missed alerts or false negatives after optimization
The trick is that the 40-60% of telemetry we stopped ingesting was genuinely low-value: health check logs, debug-level noise, duplicate traces from retries, and metrics with unbounded cardinality that no dashboard ever queried.
Results
- 40–60% lower monthly telemetry spend
- Stable query performance with partition pruning
- Retained decision‑grade signals for SLOs and incident response
- No increase in MTTR or missed incidents post-optimization
The playbook extends to any cloud provider with similar levers. The principle is universal: sample at the edge, aggregate at the collector, tier by value, and verify you kept what matters. For more on the full observability framework these optimizations sit within, see Comprehensive Observability on GCP with OpenTelemetry.