How we built an end-to-end observability framework on Google Cloud Platform that actually scales — standardizing on OpenTelemetry, leaning on native GCP services, and keeping costs predictable without losing fidelity. Below are the architecture diagrams and copy-pasteable configs we use in production.
Why OpenTelemetry on GCP?
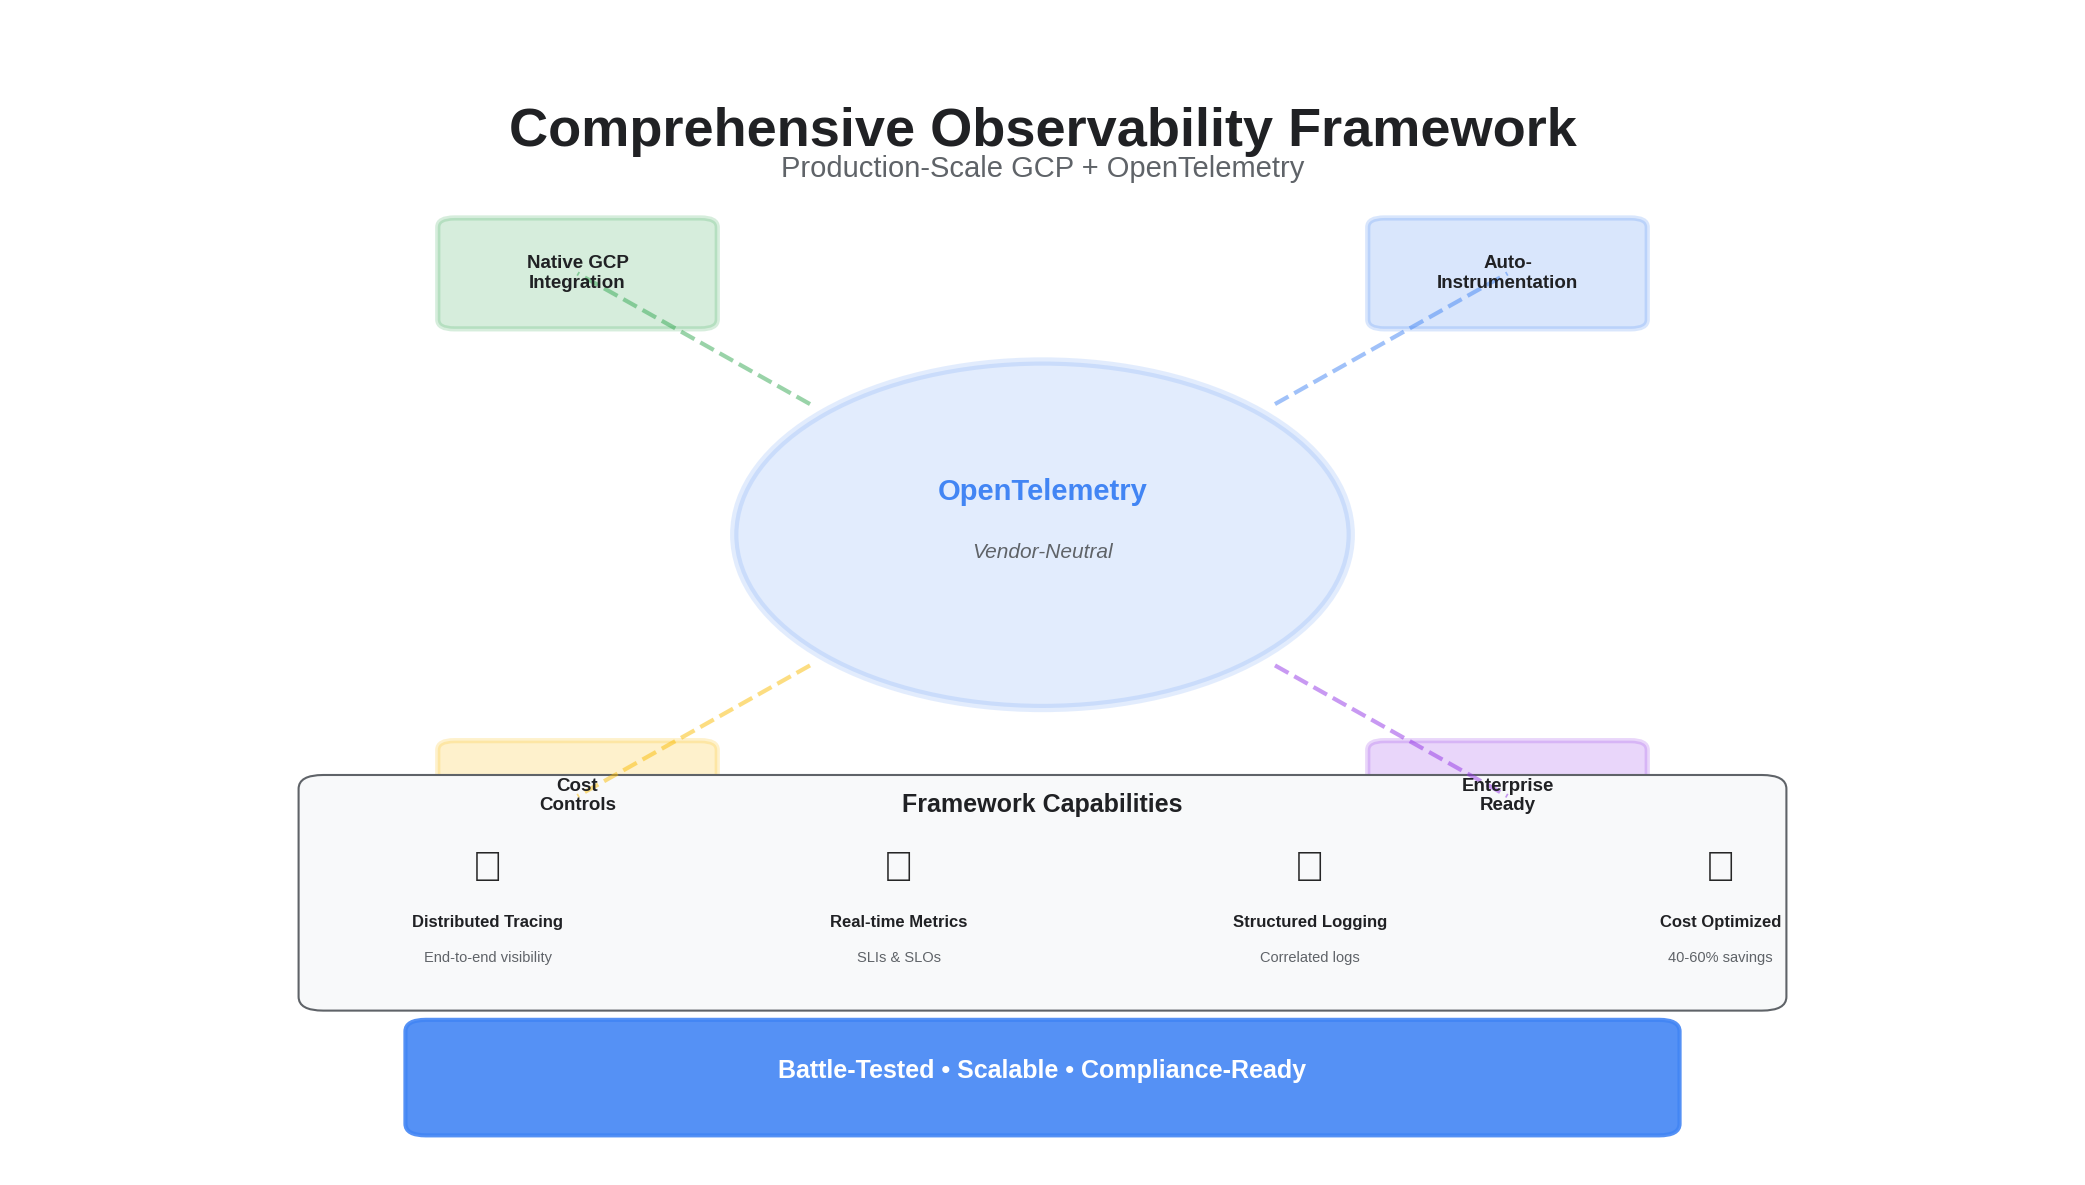
GCP has native observability tools — Cloud Monitoring, Cloud Trace, Cloud Logging — and they work well individually. The problem is correlation. When a user reports slow checkout, you need to connect the request trace, the relevant logs, and the infrastructure metrics into a single investigation flow. Native tools silo these signals.
OpenTelemetry solves this by standardizing instrumentation at the source. Every service emits traces, metrics, and logs through a single SDK, with consistent resource attributes (service name, environment, team) that make cross-signal correlation trivial. The OTel Collector then routes these signals to GCP's native backends, giving you the best of both worlds: vendor-native storage and querying with vendor-neutral instrumentation.
The key architectural decisions:
- Collector as gateway — Every cluster runs one or more OTel Collectors as centralized gateways. Services send telemetry to the collector, not directly to GCP. This decouples instrumentation from the backend and gives us a single point for sampling, redaction, and routing.
- Resource detection — The collector automatically enriches telemetry with GCP metadata (project, zone, cluster, pod) via the
resourcedetectionprocessor. Services don't need to know where they're running. - PII redaction at the collector — Before telemetry leaves the cluster, the collector strips sensitive attributes (emails, auth tokens). This is especially important in healthcare environments where PHI can leak into trace attributes.
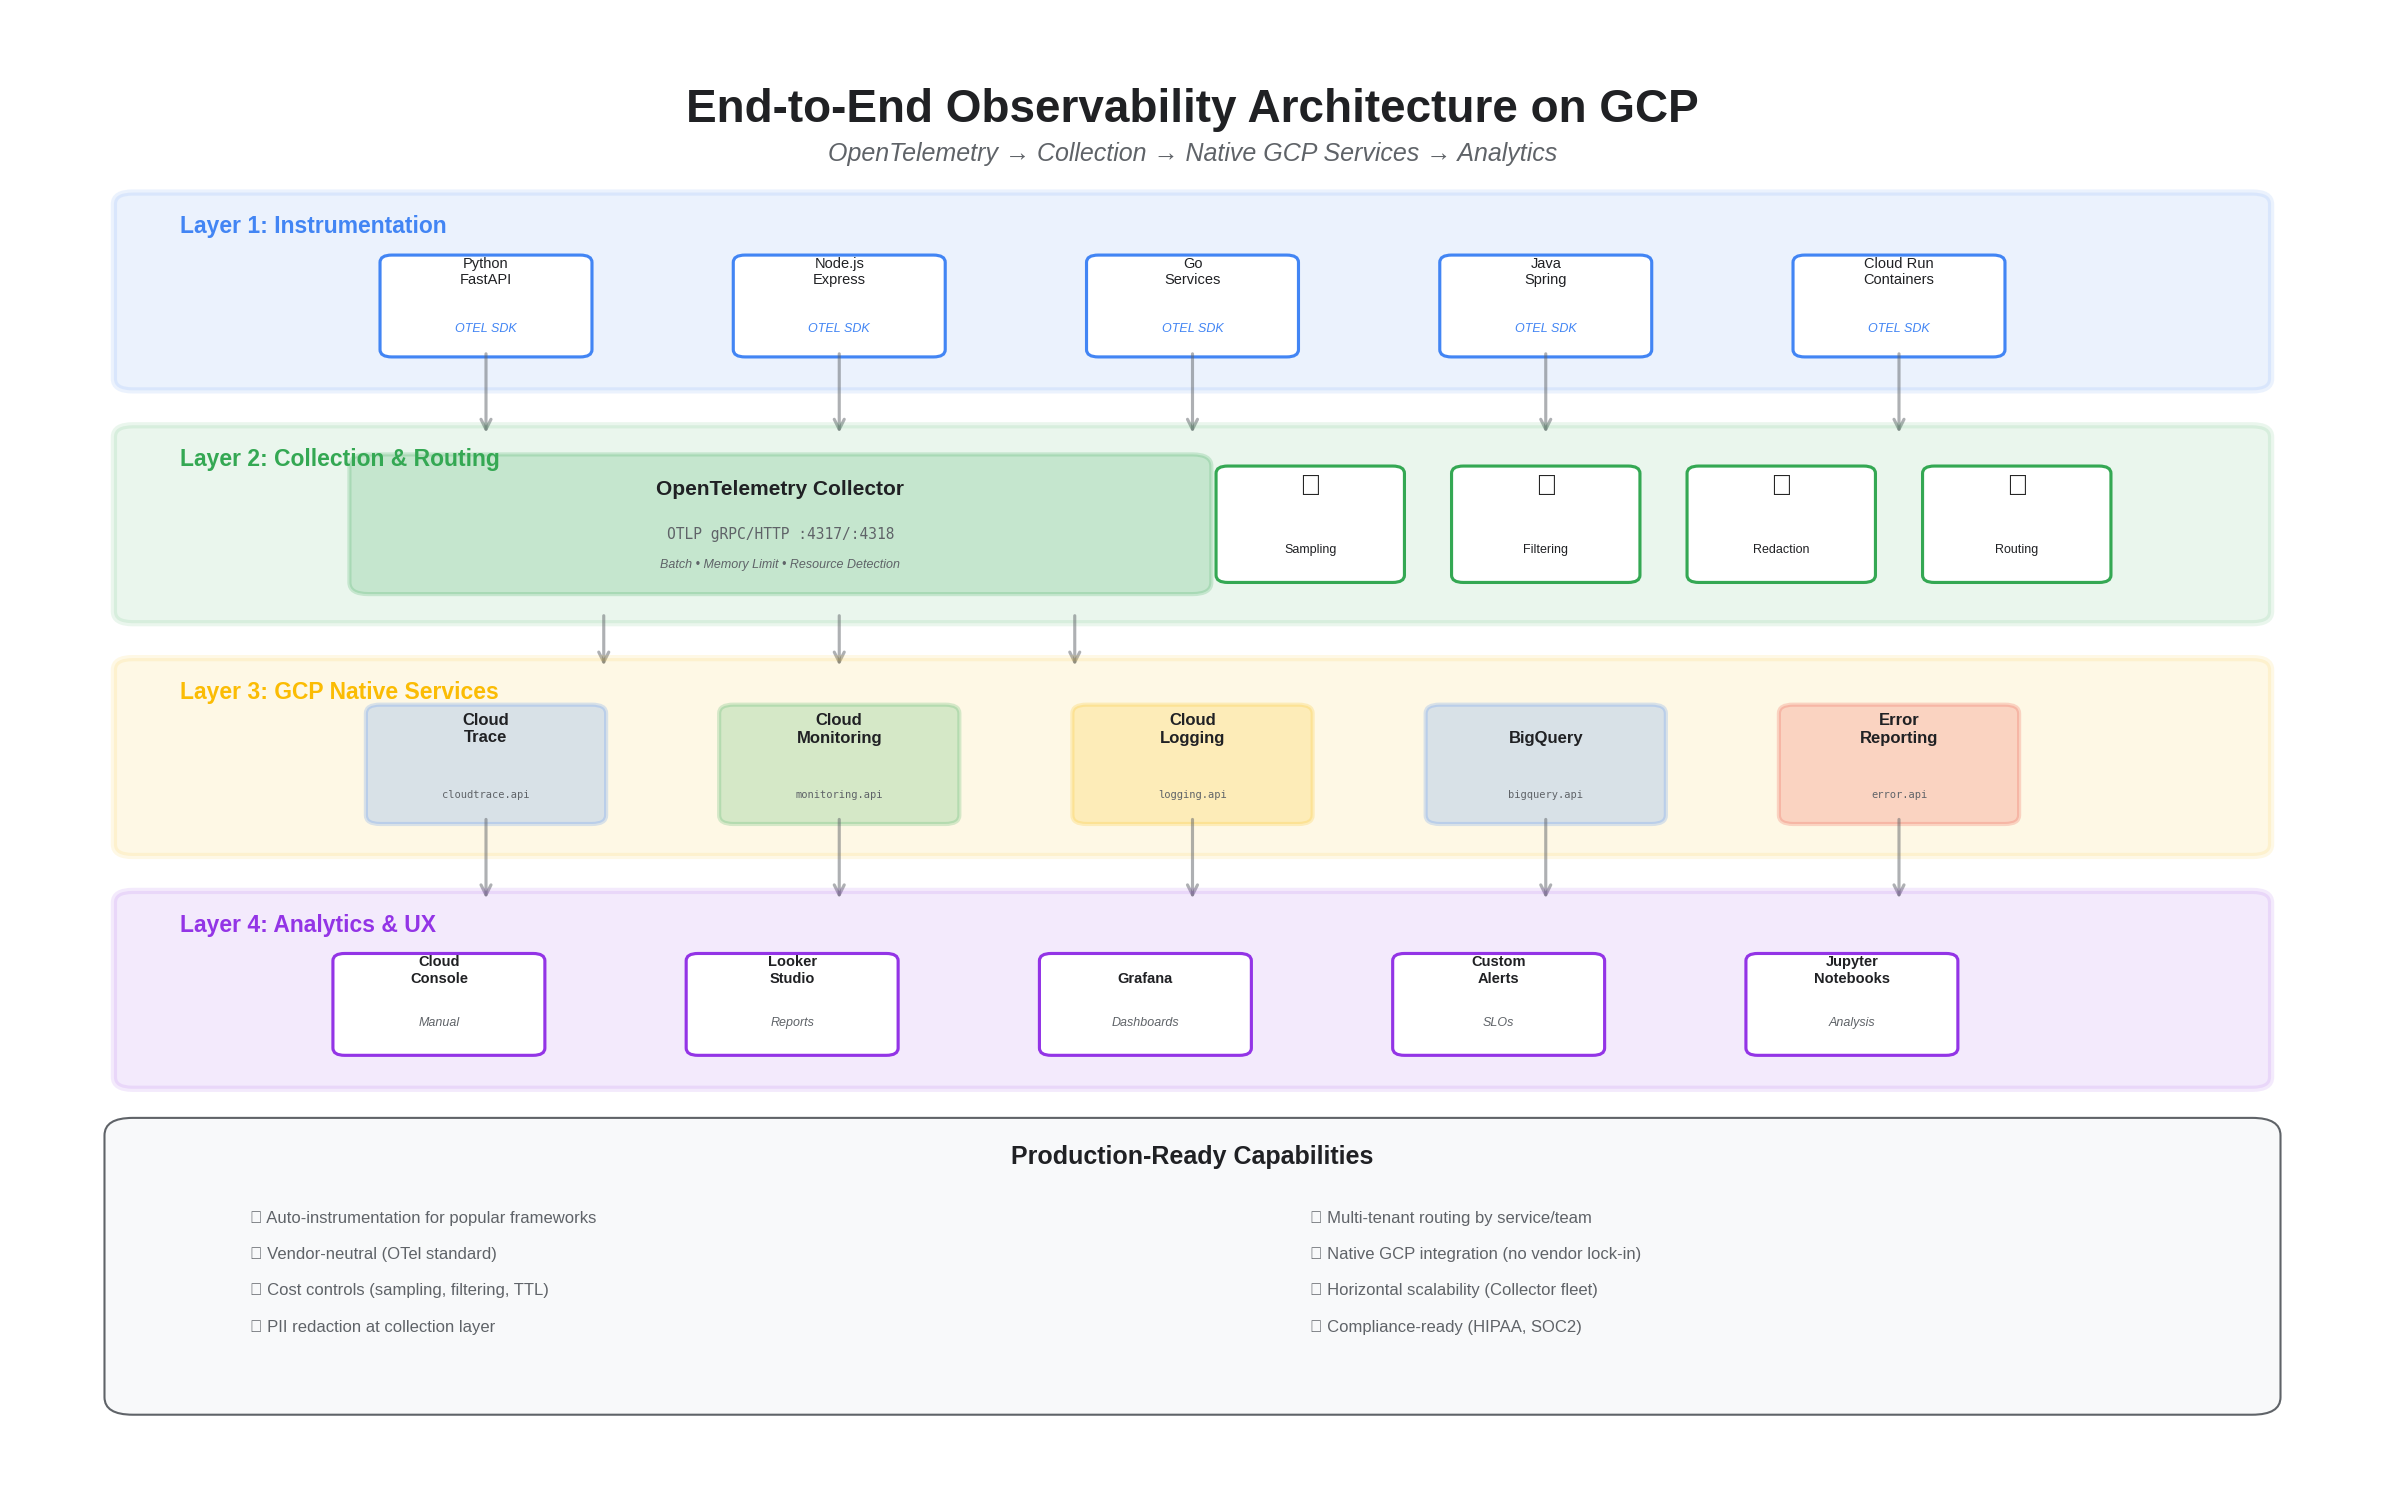
Architecture Overview

Layered design: instrumentation → collection/routing → GCP native services → analytics & UX.
Dataflow: OTEL → GCP
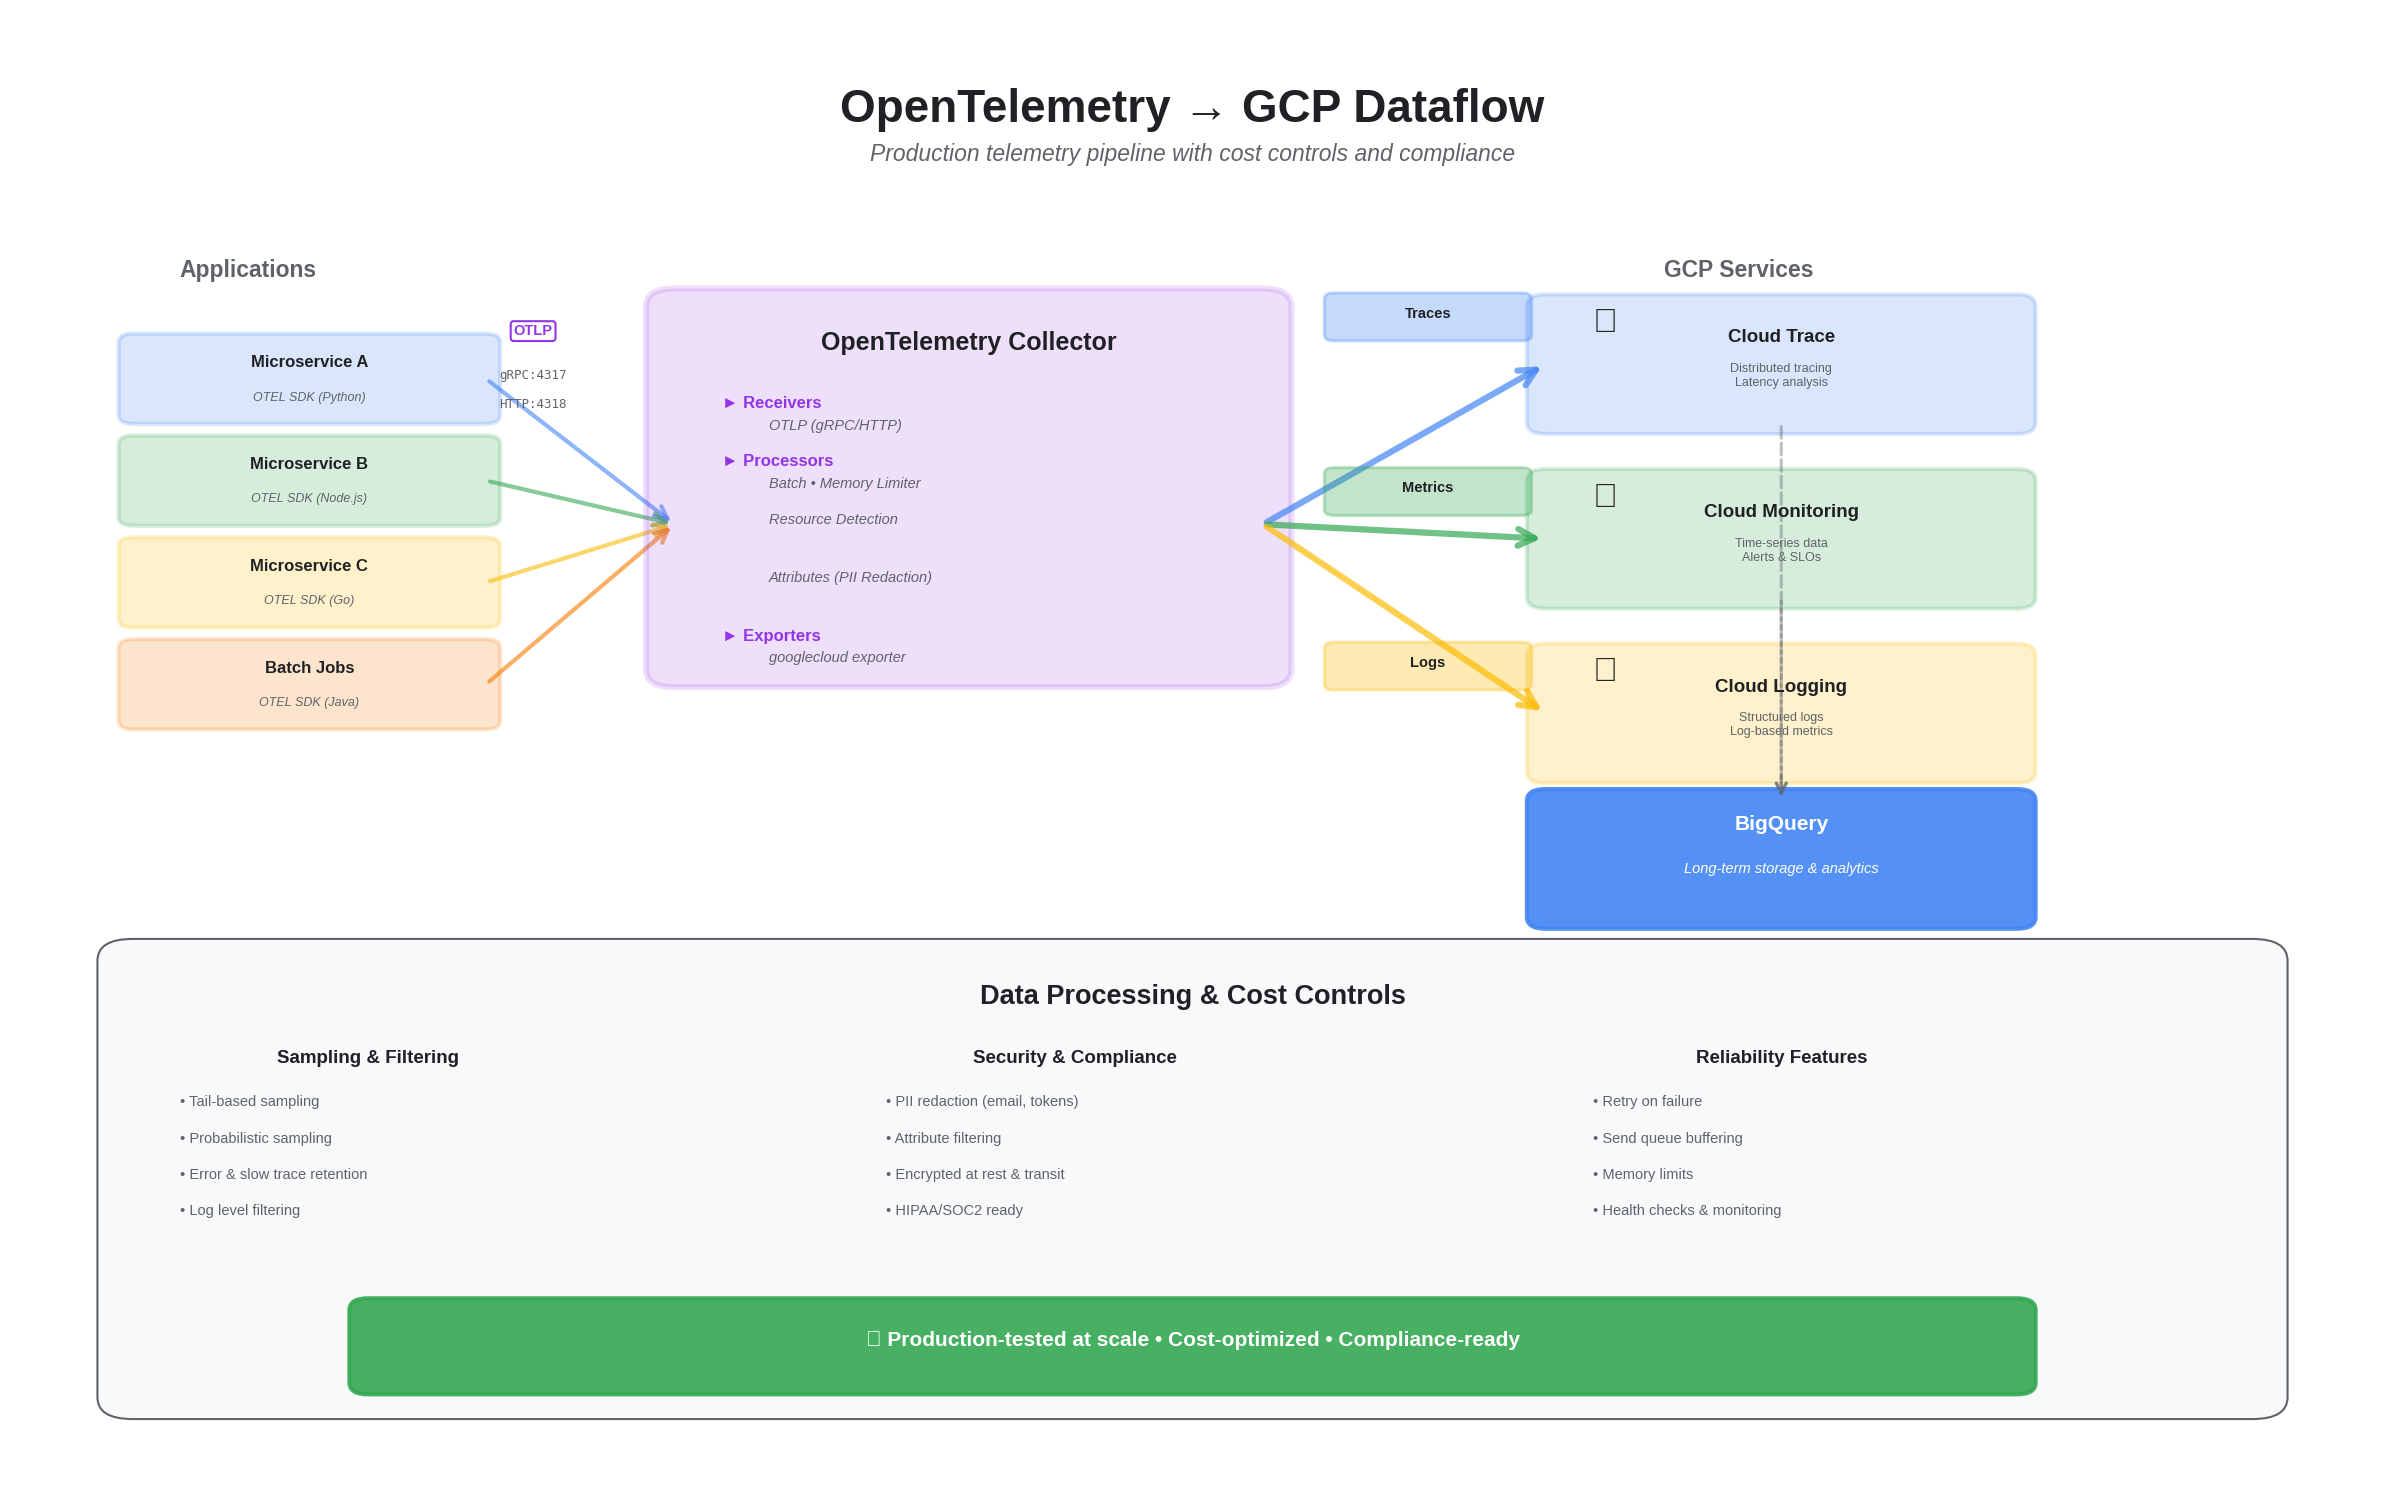
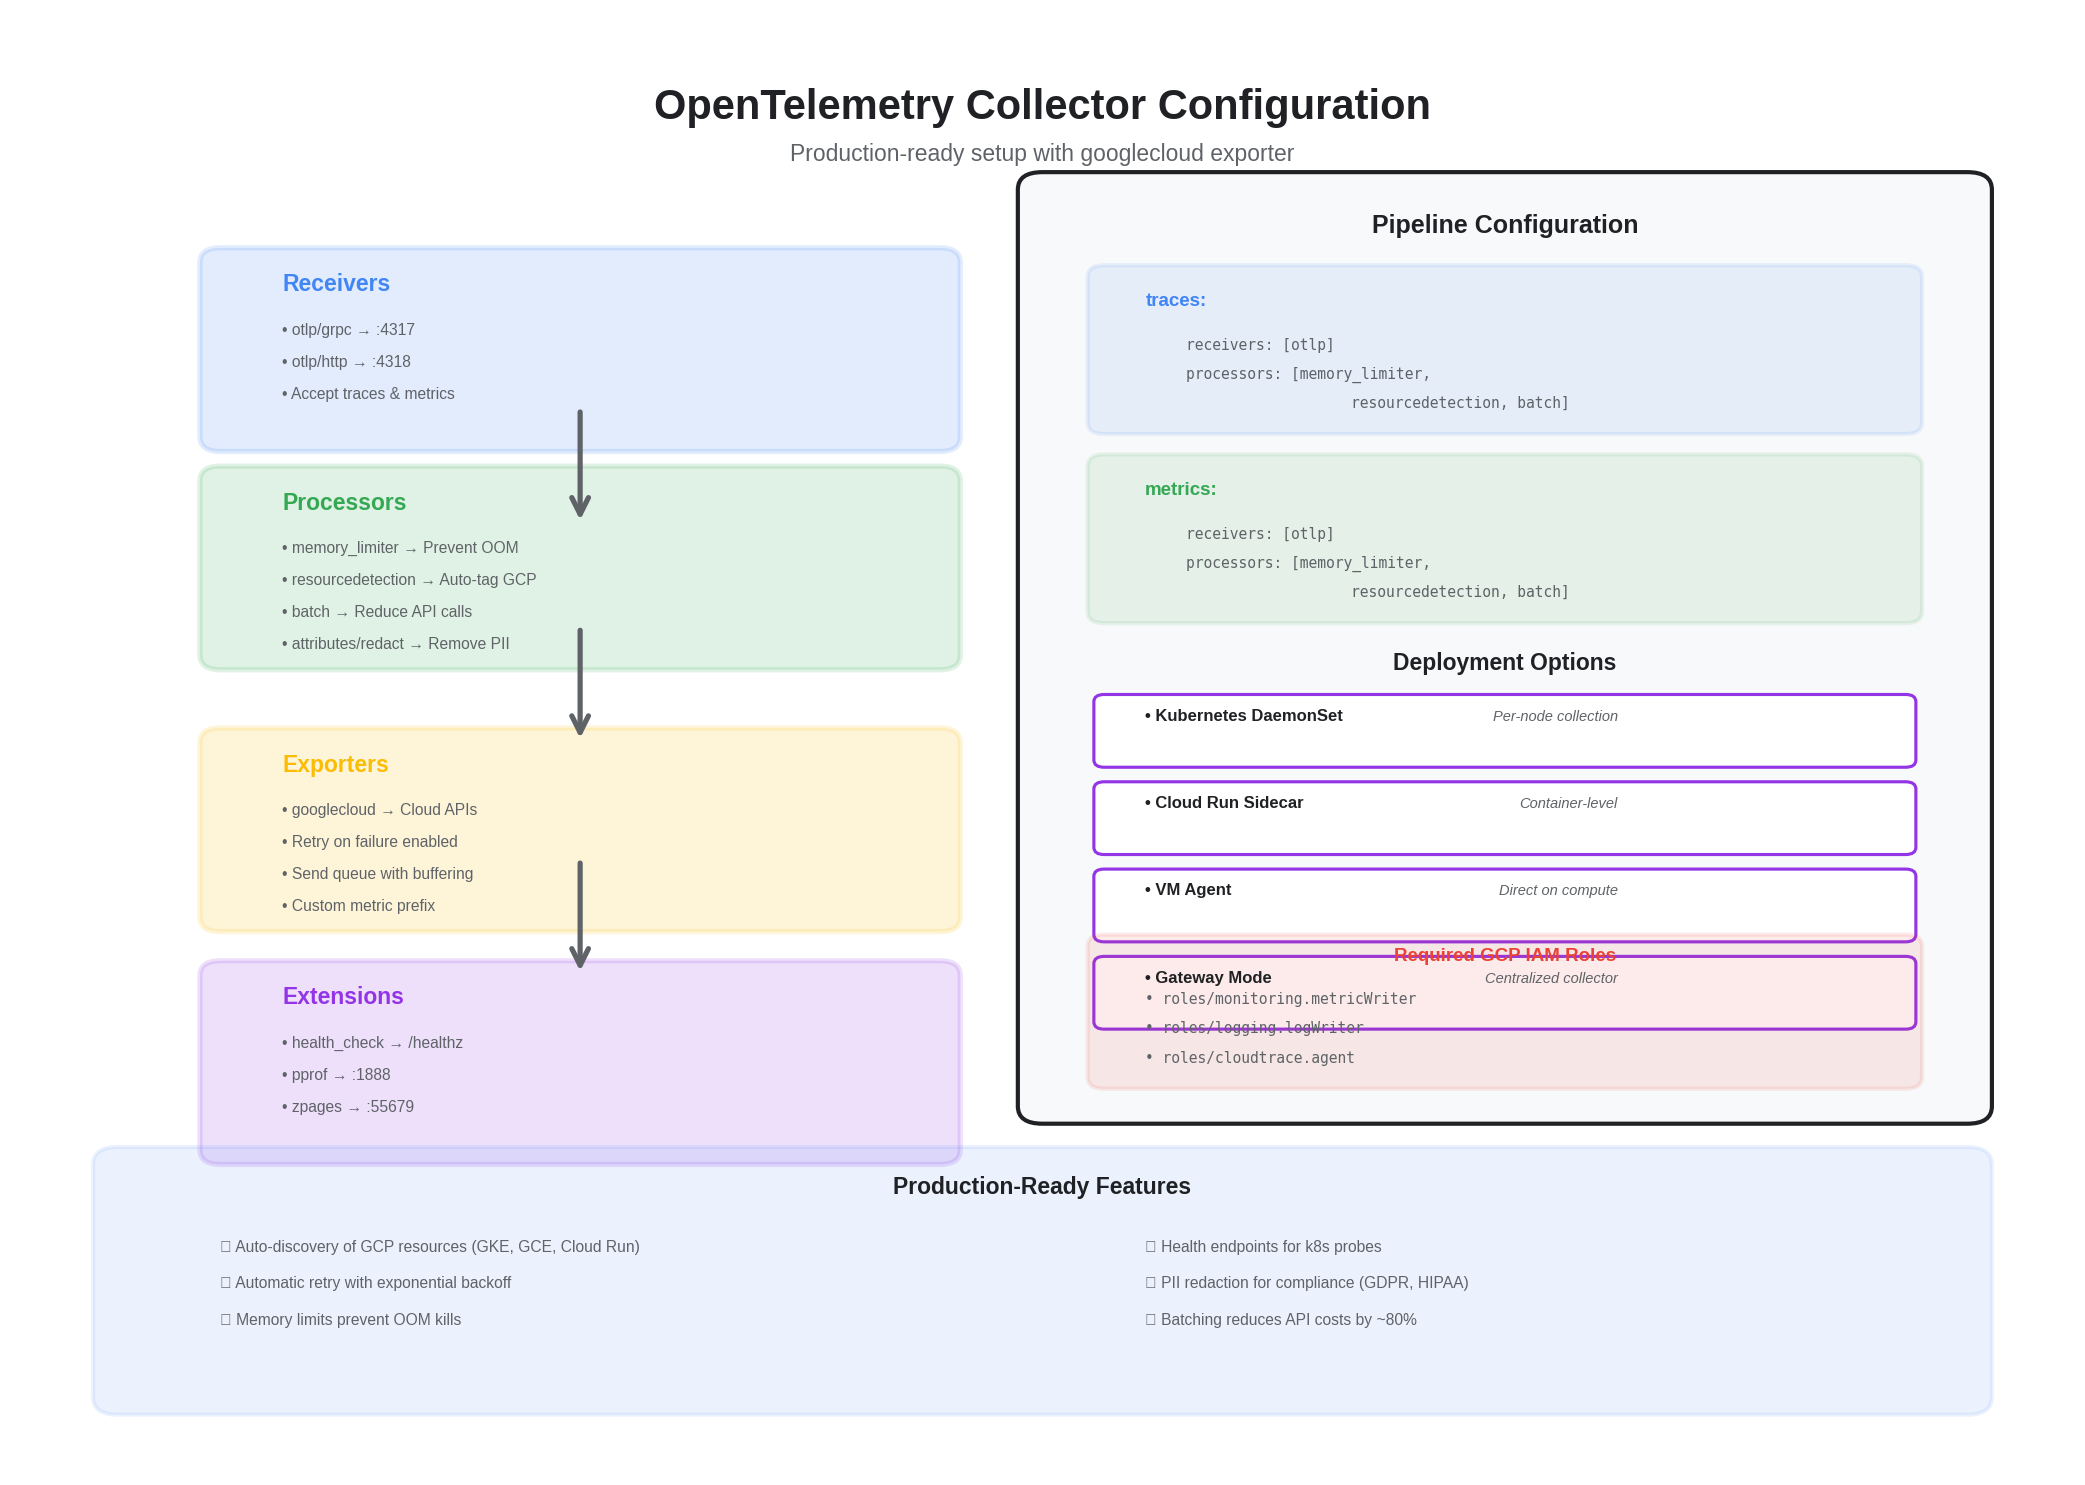
OpenTelemetry Collector (googlecloud exporter)
Single collector profile for traces and metrics. Add optional sampling/redaction and route by service/tenant.
receivers:
  otlp:
    protocols:
      grpc:
      http:

processors:
  batch:
    send_batch_size: 8192
    timeout: 2s
  memory_limiter:
    check_interval: 2s
    limit_percentage: 75
    spike_limit_percentage: 15
  resourcedetection:
    detectors: [env, gcp, system, k8s]
    timeout: 5s
  attributes/redact_pii:
    actions:
      - key: user.email
        action: delete
      - key: auth.token
        action: delete

exporters:
  googlecloud:
    project: YOUR_GCP_PROJECT_ID
    user_agent: "otel-collector"
    metric:
      prefix: custom.googleapis.com/opencensus
      skip_create_descriptor: false
    retry_on_failure:
      enabled: true
    sending_queue:
      enabled: true
      num_consumers: 4
      queue_size: 2048

extensions:
  health_check:
  pprof:
    endpoint: :1888
  zpages:
    endpoint: :55679

service:
  extensions: [health_check, pprof, zpages]
  pipelines:
    traces:
      receivers: [otlp]
      processors: [memory_limiter, resourcedetection, attributes/redact_pii, batch]
      exporters: [googlecloud]
    metrics:
      receivers: [otlp]
      processors: [memory_limiter, resourcedetection, batch]
      exporters: [googlecloud]
Python (FastAPI) — minimal OTEL setup
# pip install fastapi uvicorn opentelemetry-distro opentelemetry-exporter-otlp \
# opentelemetry-instrumentation-fastapi opentelemetry-instrumentation-requests

import os
from fastapi import FastAPI
from opentelemetry import trace
from opentelemetry.exporter.otlp.proto.grpc.trace_exporter import OTLPSpanExporter
from opentelemetry.sdk.trace import TracerProvider
from opentelemetry.sdk.trace.export import BatchSpanProcessor
from opentelemetry.sdk.resources import Resource

OTEL_ENDPOINT = os.getenv("OTEL_EXPORTER_OTLP_ENDPOINT", "http://otel-collector:4317")
SERVICE_NAME = os.getenv("OTEL_SERVICE_NAME", "payments-api")

provider = TracerProvider(resource=Resource.create({"service.name": SERVICE_NAME}))
processor = BatchSpanProcessor(OTLPSpanExporter(endpoint=OTEL_ENDPOINT, insecure=True))
provider.add_span_processor(processor)
trace.set_tracer_provider(provider)

app = FastAPI()

@app.get("/healthz")
def healthz():
    return {"ok": True}
Node.js (Express) — SDK with auto-instrumentations
// npm i @opentelemetry/sdk-node @opentelemetry/auto-instrumentations-node \
// @opentelemetry/exporter-trace-otlp-grpc

const { NodeSDK } = require("@opentelemetry/sdk-node");
const { OTLPTraceExporter } = require("@opentelemetry/exporter-trace-otlp-grpc");
const { getNodeAutoInstrumentations } = require("@opentelemetry/auto-instrumentations-node");
const { Resource } = require("@opentelemetry/resources");
const { SemanticResourceAttributes } = require("@opentelemetry/semantic-conventions");

const endpoint = process.env.OTEL_EXPORTER_OTLP_ENDPOINT || "http://otel-collector:4317";

const sdk = new NodeSDK({
  resource: new Resource({
    [SemanticResourceAttributes.SERVICE_NAME]: process.env.OTEL_SERVICE_NAME || "orders-api",
  }),
  traceExporter: new OTLPTraceExporter({ url: endpoint }),
  instrumentations: [getNodeAutoInstrumentations()],
});

sdk.start();
Terraform — enable APIs and permissions
terraform {
  required_providers {
    google = {
      source  = "hashicorp/google"
      version = "~> 5.0"
    }
  }
}

provider "google" {
  project = var.project_id
  region  = var.region
}

resource "google_project_service" "services" {
  for_each = toset([
    "monitoring.googleapis.com",
    "logging.googleapis.com",
    "cloudtrace.googleapis.com",
  ])
  service                    = each.key
  disable_on_destroy         = false
}

resource "google_service_account" "otel_sa" {
  account_id   = "otel-collector"
  display_name = "OTel Collector"
}

resource "google_project_iam_member" "otel_roles" {
  for_each = {
    monitoring = "roles/monitoring.metricWriter"
    logging    = "roles/logging.logWriter"
    trace      = "roles/cloudtrace.agent"
  }
  role   = each.value
  member = "serviceAccount:${google_service_account.otel_sa.email}"
}
Cloud Run Deployment Notes
- Set environment:
OTEL_EXPORTER_OTLP_ENDPOINT=https://otel-collector.your-domain/ - Use a private Collector behind an internal/external LB with auth if needed
- Add
OTEL_SERVICE_NAMEper service; includeOTEL_RESOURCE_ATTRIBUTESfor team/owner/env
Dashboards and Alerting: SLO-First Approach
With telemetry flowing into GCP, the next step is making it actionable. We follow an SLO-first approach to dashboarding:
- Service overview dashboard — For each service: availability SLI (successful requests / total requests), latency SLI (p50, p95, p99), error budget remaining, and active traces for recent errors. This is the first page an on-call engineer sees.
- Infrastructure dashboard — CPU, memory, disk, and network utilization across nodes, with overlays showing deployment events. Used for capacity planning, not incident response.
- Cost dashboard — Telemetry ingestion volume by service, projected monthly cost, and top contributors to metric cardinality. This prevents observability spend from growing unchecked.
Alerting is error-budget-driven: alerts fire when the error budget burn rate exceeds a threshold (e.g., consuming 10% of monthly budget in 1 hour), not when individual requests fail. This eliminates noise from transient errors while catching sustained degradation. For more on cost optimization, see Cost-Optimized Telemetry Management on GCP. For serverless-specific patterns, see Serverless Observability on Cloud Run.