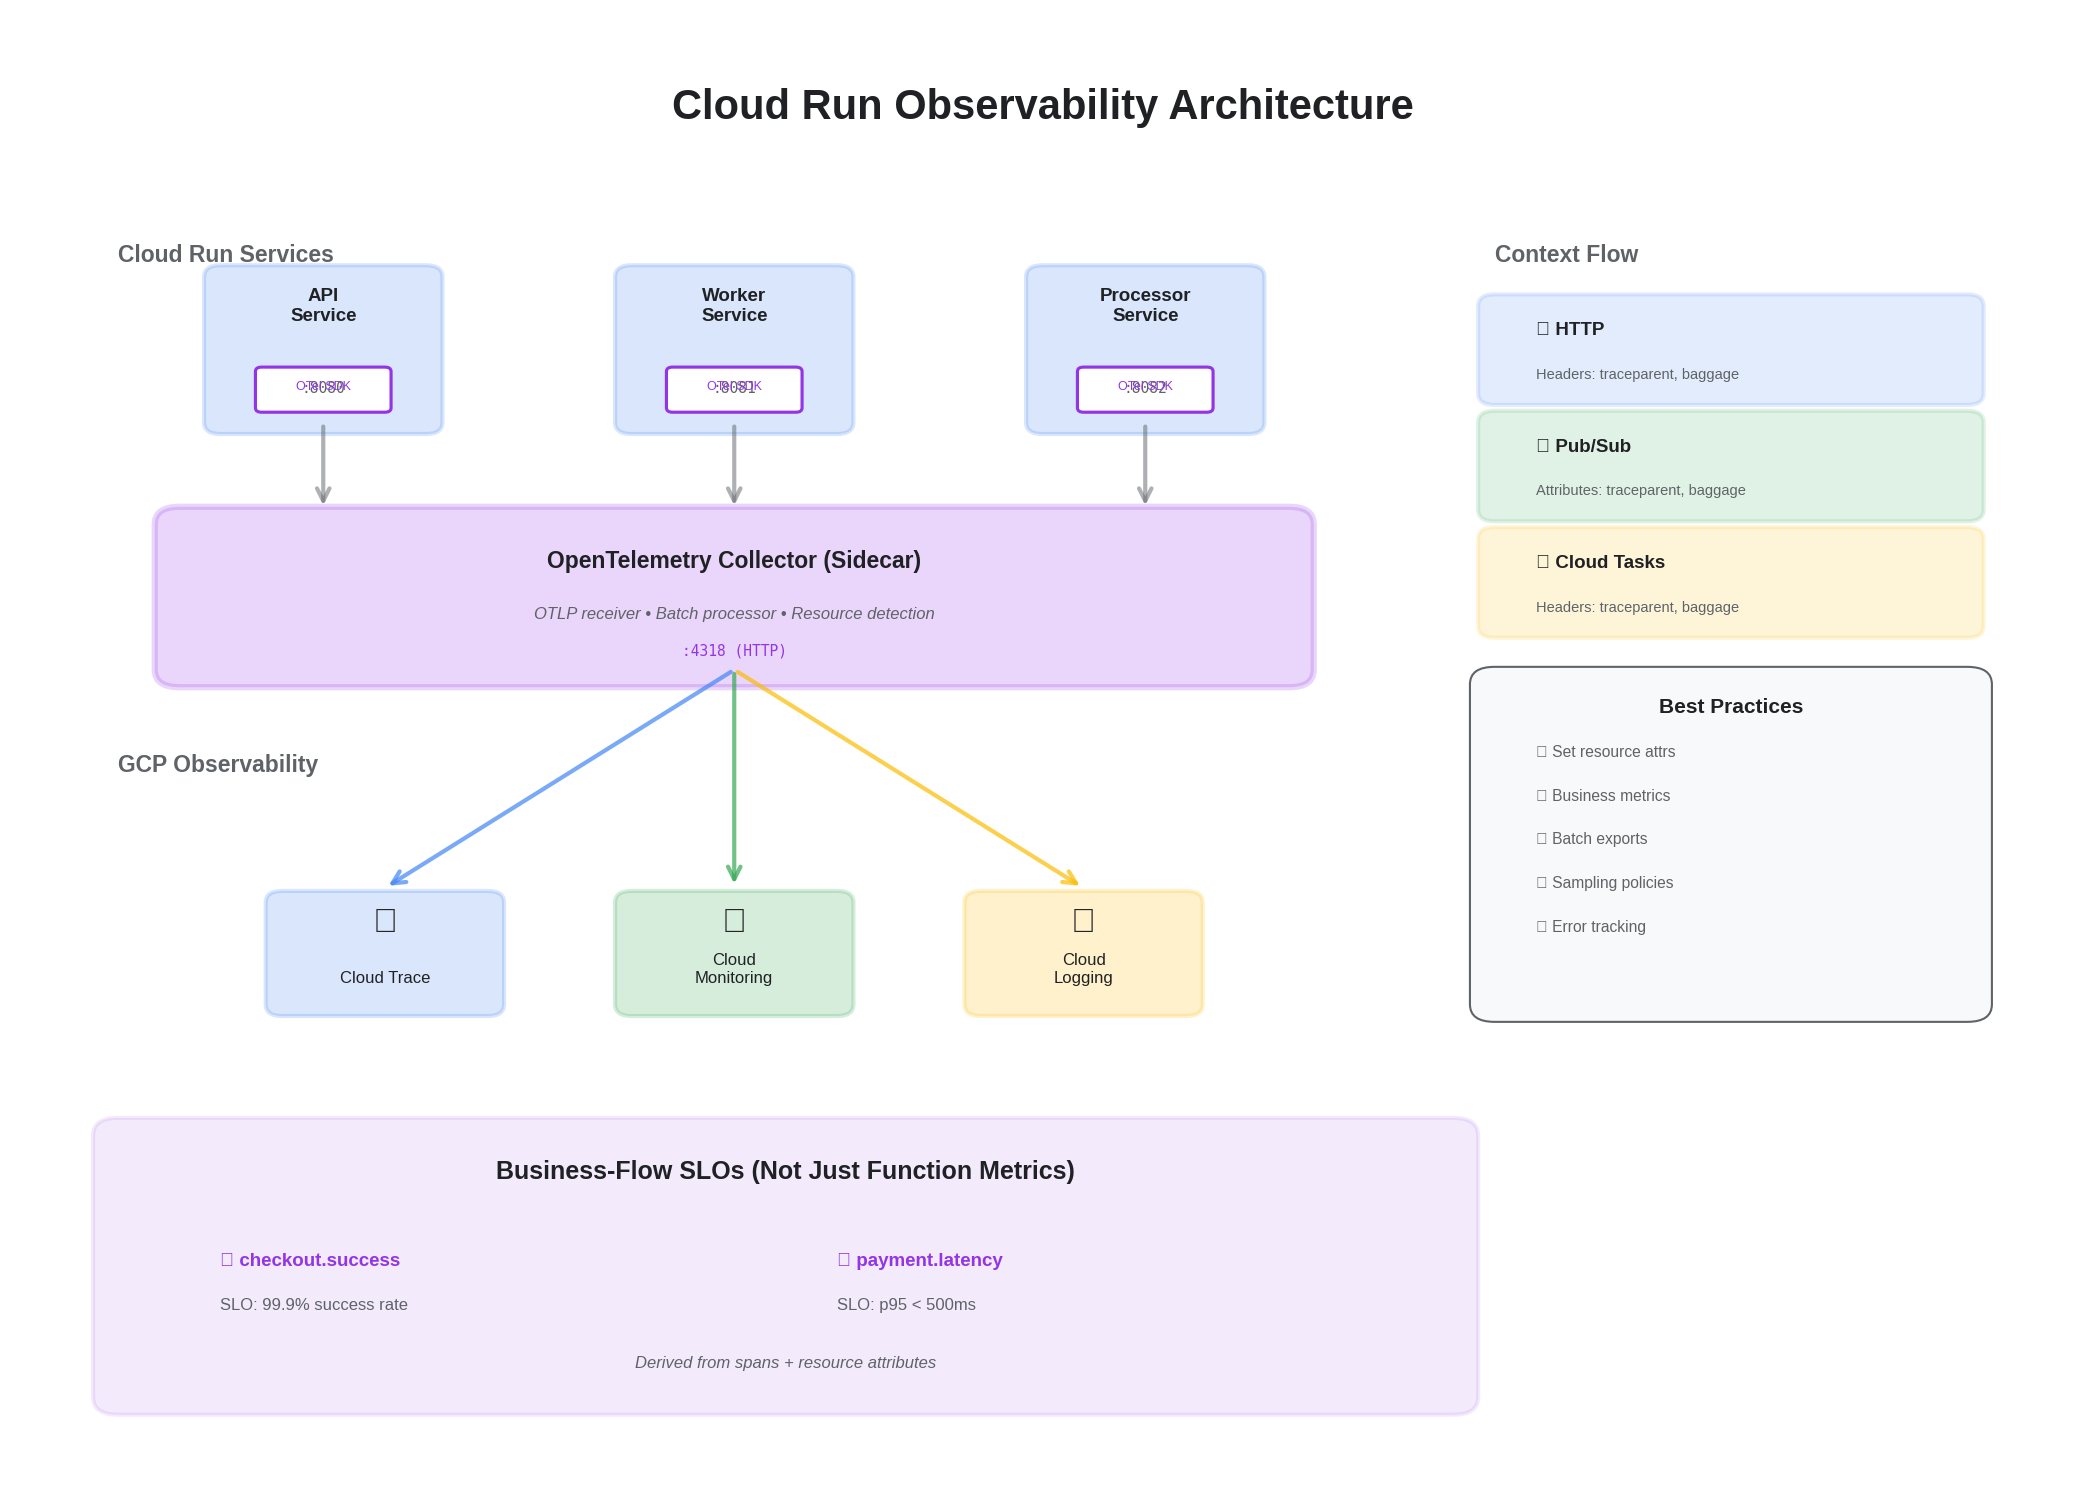
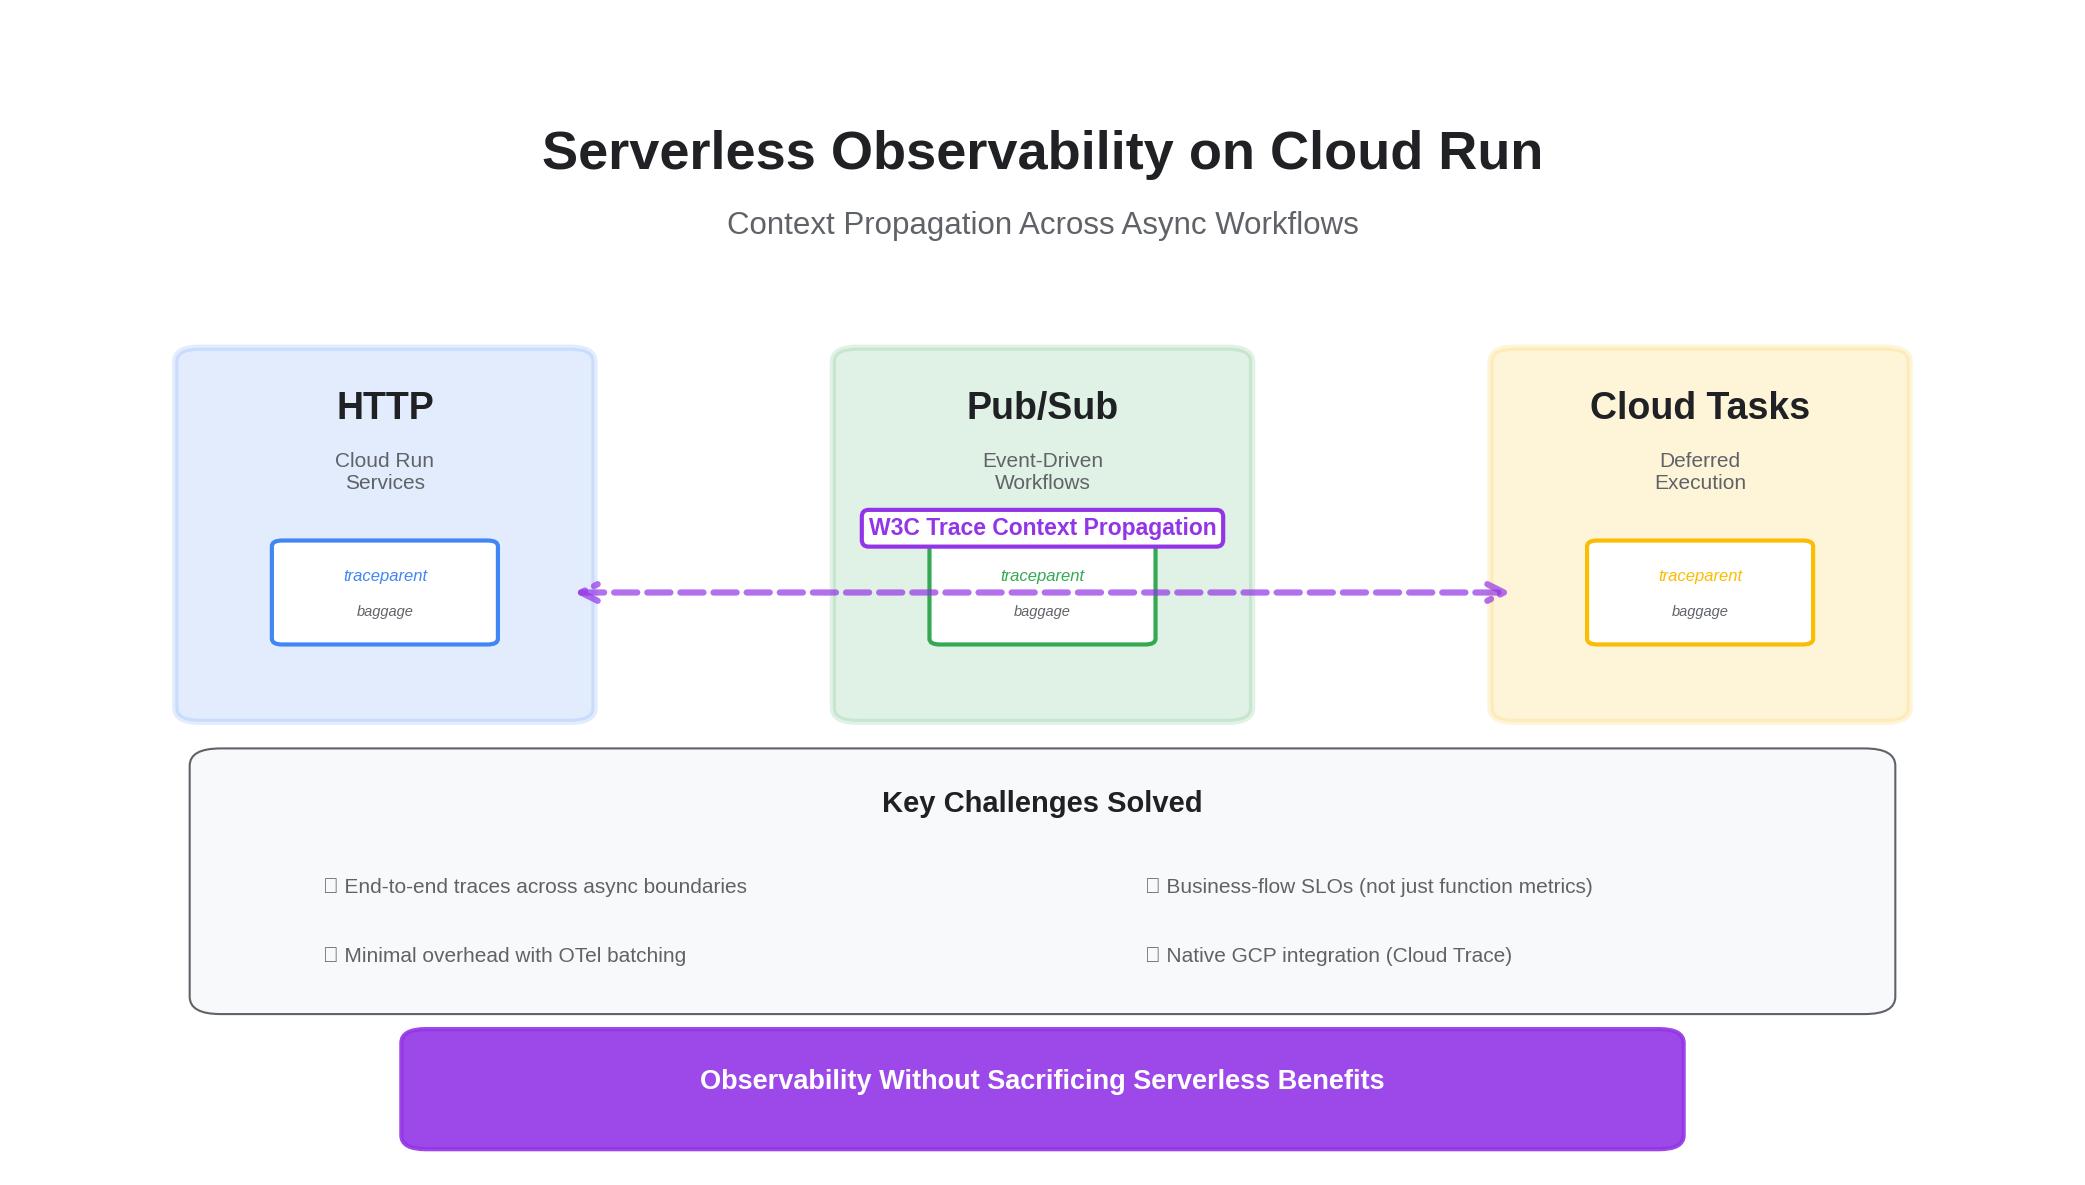
The challenge with serverless isn’t instrumentation — it’s context. Here’s how to keep traces intact across HTTP, Pub/Sub, and Cloud Tasks with minimal overhead, and how to express SLOs that map to business flows instead of just functions.
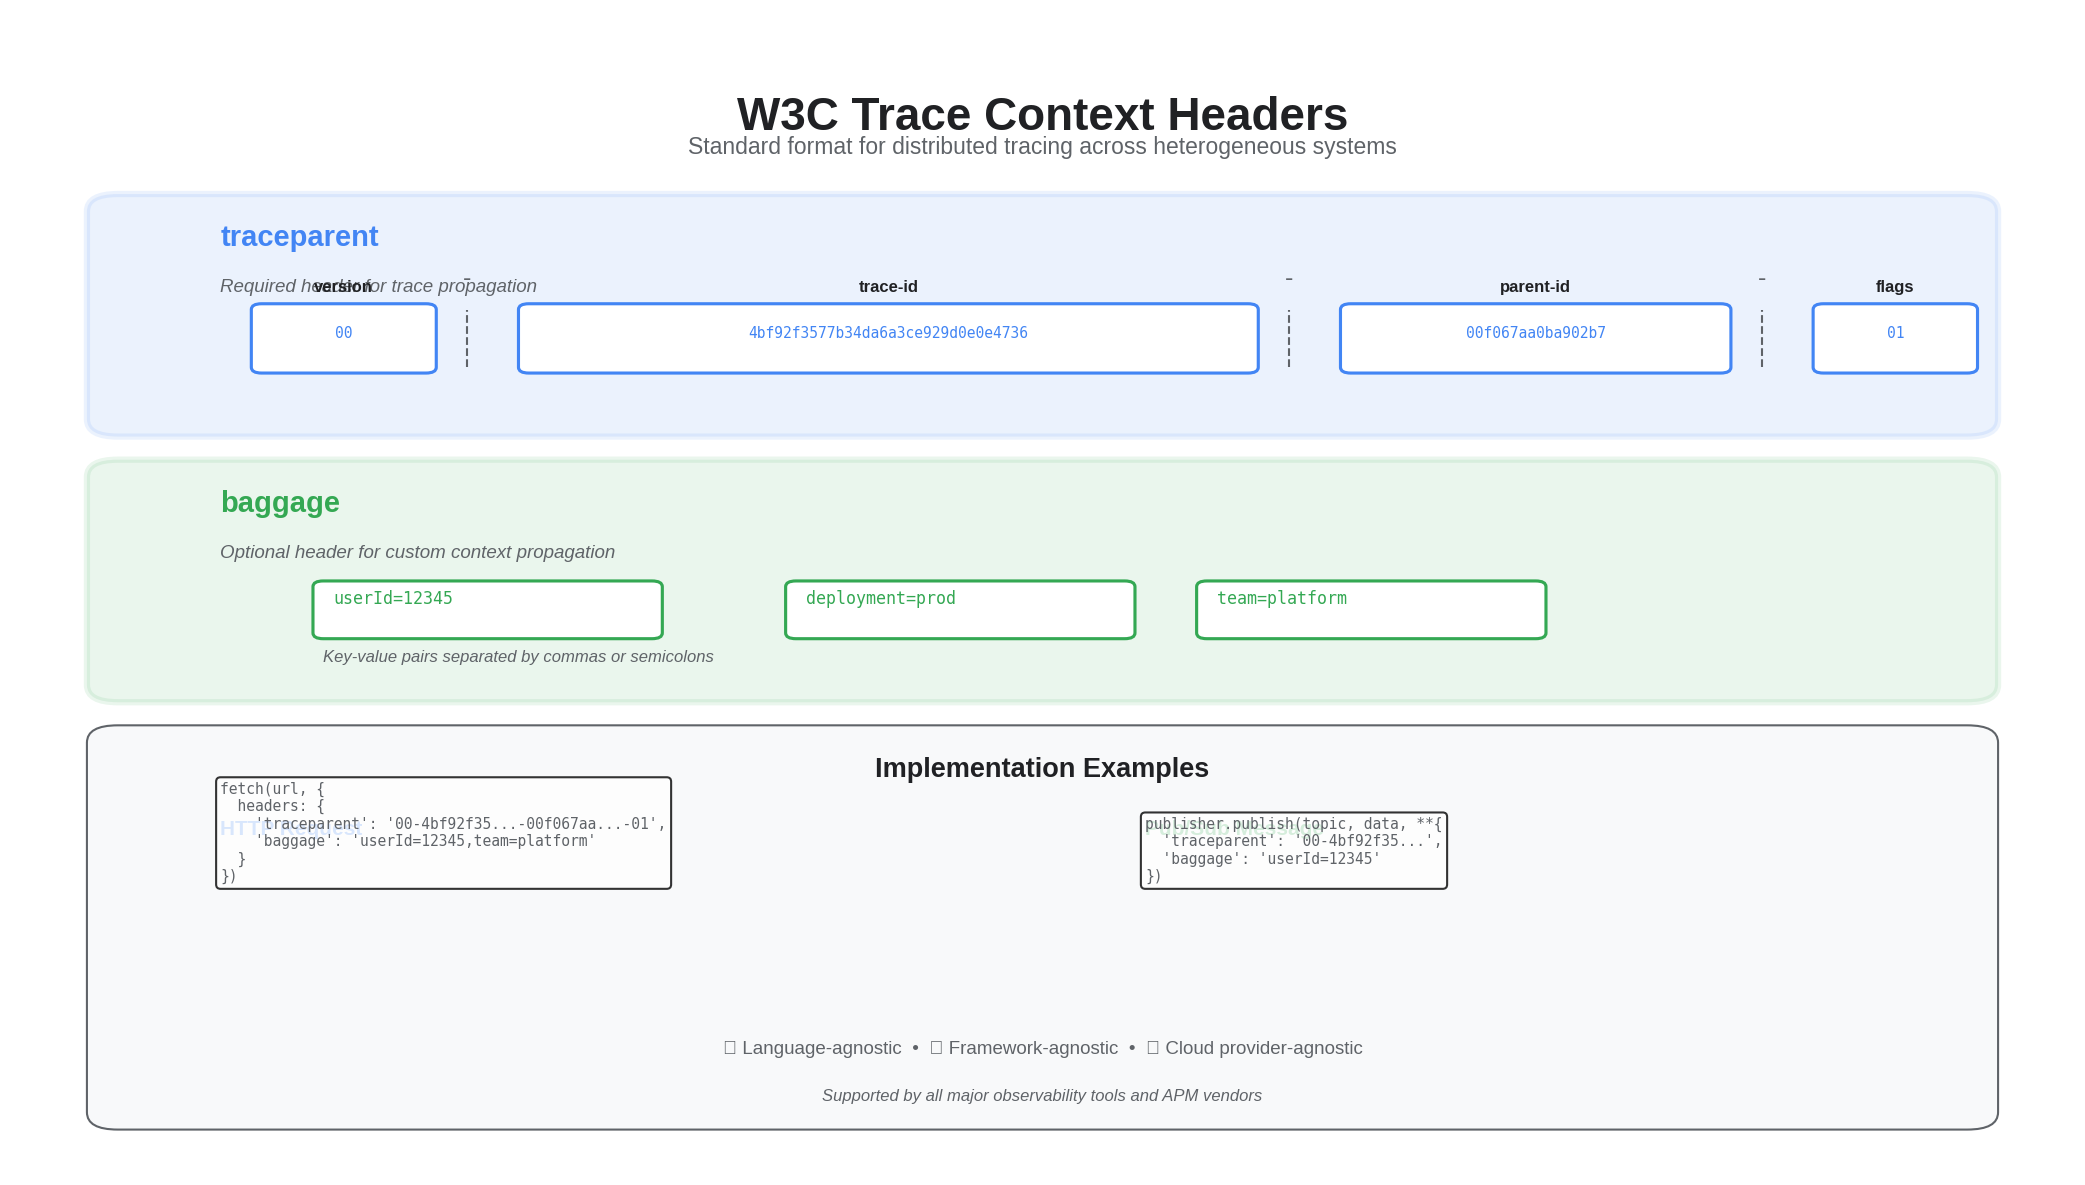
1) HTTP: W3C Trace Context passthrough
// Cloud Run (Node/Express) — forward and start spans
const express = require("express");
const fetch = require("node-fetch");
const app = express();

app.get("/ingest", async (req, res) => {
  const traceparent = req.headers["traceparent"];
  const baggage = req.headers["baggage"];
  const headers = {};
  if (traceparent) headers["traceparent"] = traceparent;
  if (baggage) headers["baggage"] = baggage;
  await fetch(process.env.DOWNSTREAM_URL, { headers });
  res.json({ ok: true });
});

module.exports = app;
2) Pub/Sub: attributes carry trace headers
# Publisher (Python) — copy incoming trace context to attributes
from google.cloud import pubsub_v1
from flask import request

publisher = pubsub_v1.PublisherClient()
topic = publisher.topic_path("your-project","events")

def publish(event: dict):
    attrs = {}
    if "traceparent" in request.headers:
        attrs["traceparent"] = request.headers["traceparent"]
    if "baggage" in request.headers:
        attrs["baggage"] = request.headers["baggage"]
    publisher.publish(topic, data=b"...", **attrs)
3) Cloud Tasks: propagate context in headers
from google.cloud import tasks_v2

def enqueue(url: str, payload: bytes, traceparent: str = "", baggage: str = ""):
    client = tasks_v2.CloudTasksClient()
    task = {
        "http_request": {
            "http_method": tasks_v2.HttpMethod.POST,
            "url": url,
            "headers": {
                "Content-Type": "application/json",
                "traceparent": traceparent,
                "baggage": baggage,
            },
            "body": payload,
        }
    }
    client.create_task(parent="projects/..../locations/.../queues/default", task=task)
4) OTel resource attributes for SLOs
- Set
service.name,deployment.environment,team,ownerat source for routing and dashboards - Emit request outcome as business metric (e.g.,
checkout.success) and derive SLOs
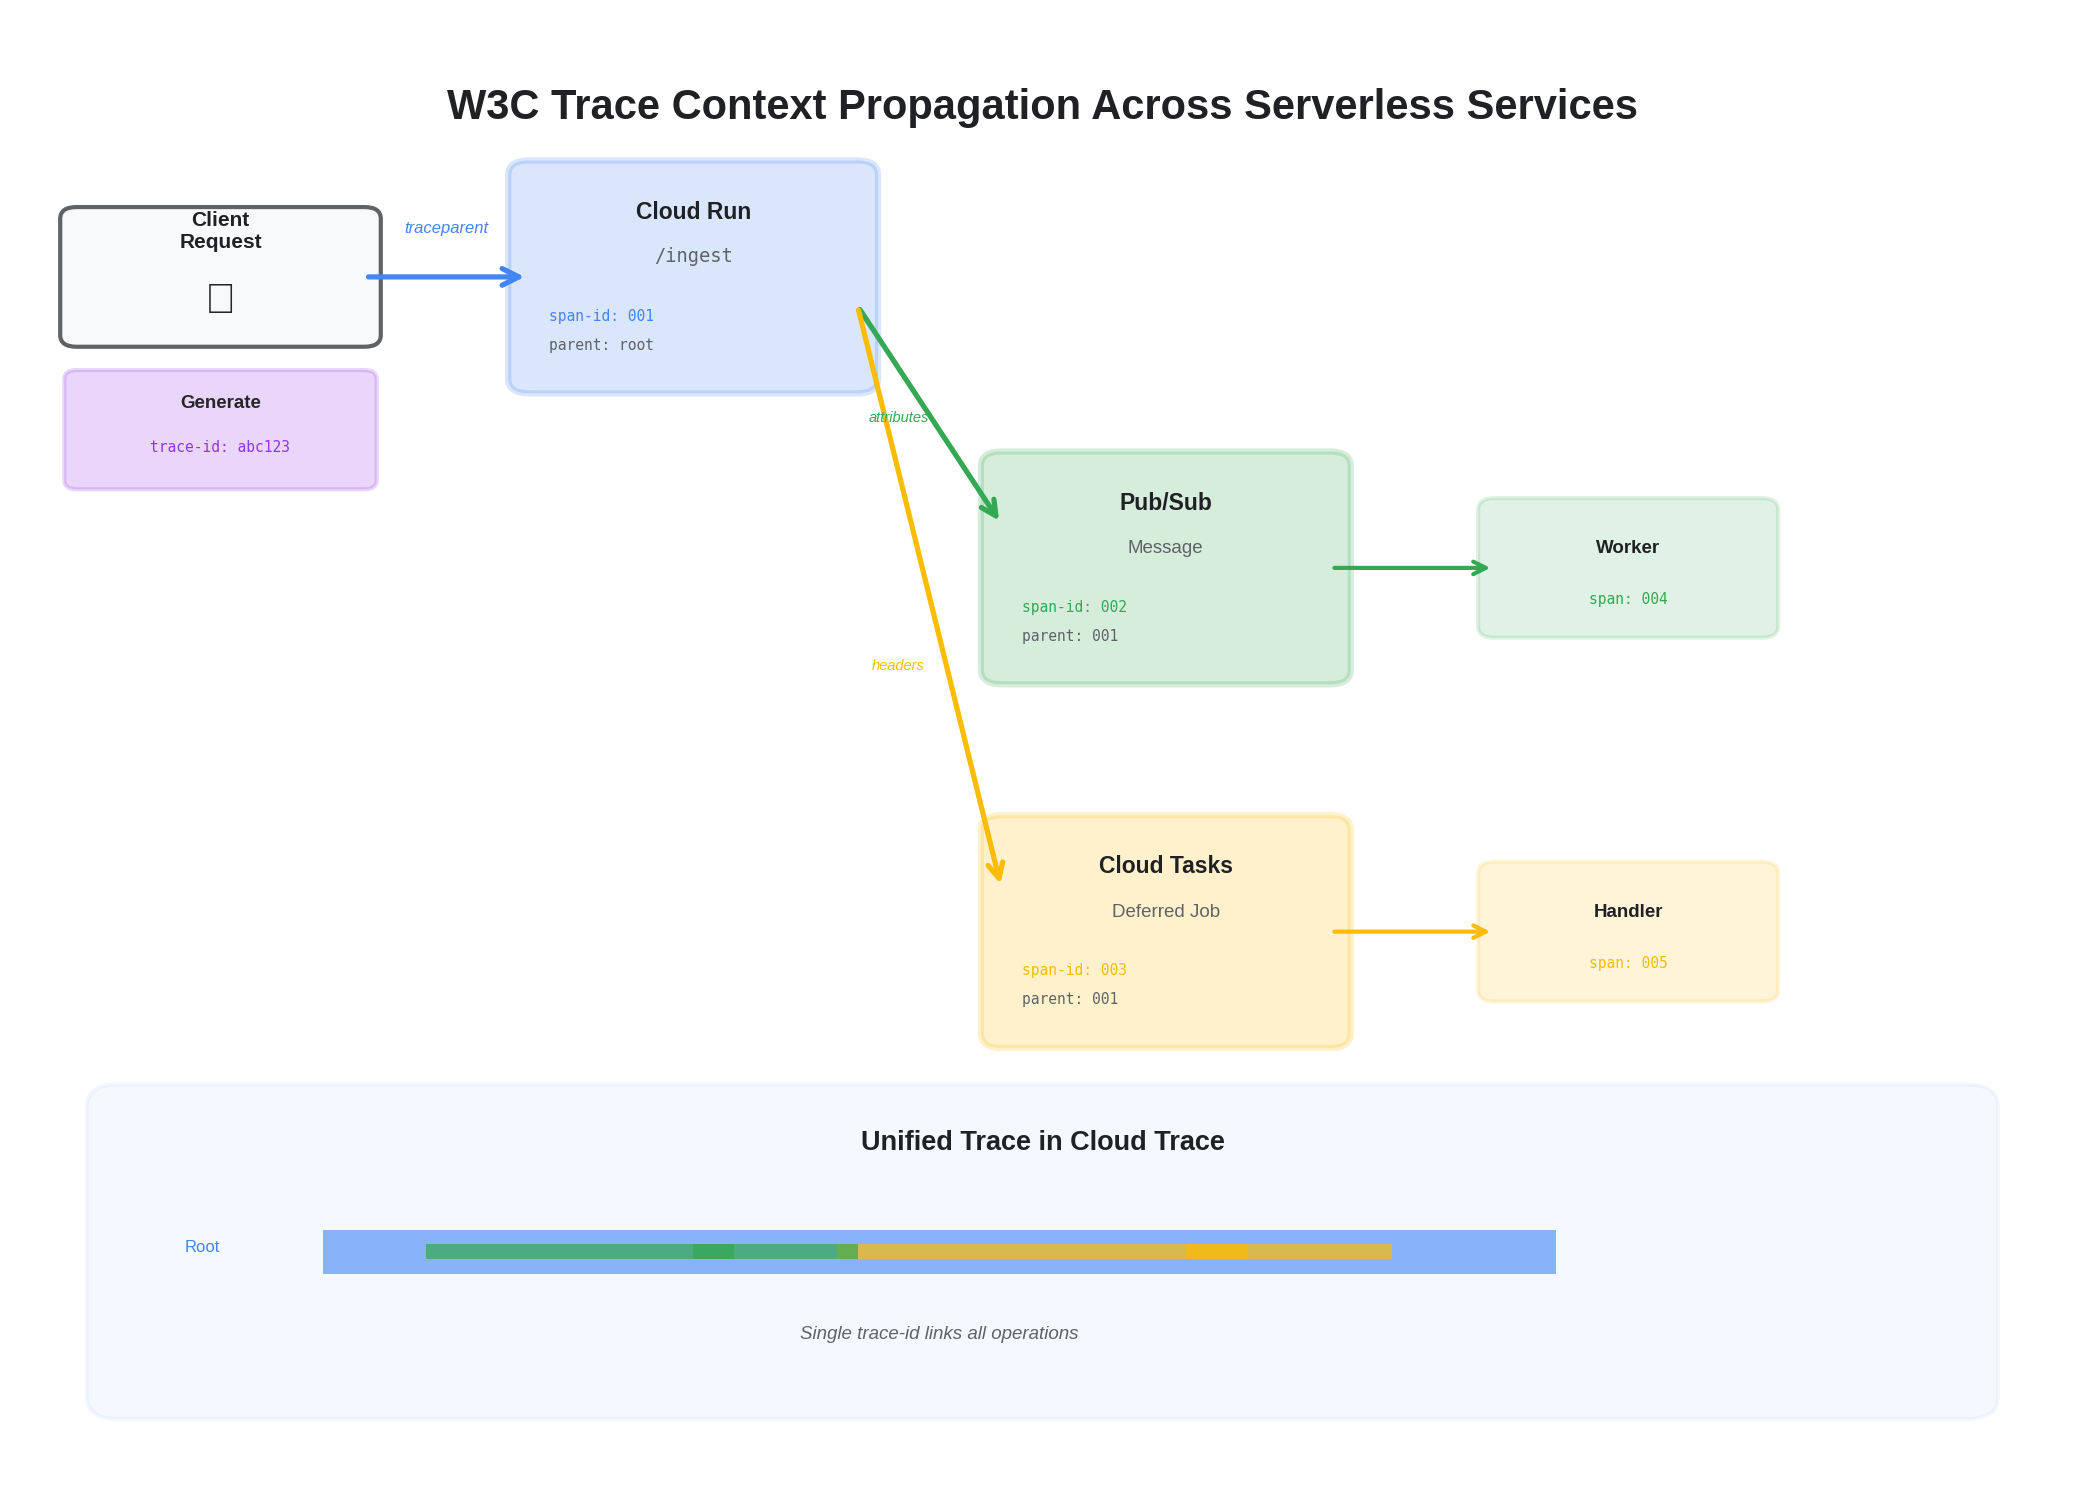
5) Subscriber: Extracting Context from Pub/Sub Messages
On the receiving end of a Pub/Sub message, the subscriber extracts trace context from message attributes to continue the distributed trace:
# Subscriber (Python) — extract trace context and create child span
from opentelemetry import trace, context
from opentelemetry.trace.propagation import get_current_span
from opentelemetry.propagators.textmap import DictGetter

tracer = trace.get_tracer(__name__)

class PubSubAttributeGetter(DictGetter):
    def get(self, carrier, key):
        return [carrier.get(key)] if carrier.get(key) else []
    def keys(self, carrier):
        return list(carrier.keys())

def handle_message(message):
    attrs = dict(message.attributes)
    ctx = extract(attrs, getter=PubSubAttributeGetter())

    with tracer.start_as_current_span("process_event", context=ctx) as span:
        span.set_attribute("messaging.system", "pubsub")
        span.set_attribute("messaging.message_id", message.message_id)
        # Process the message...
        message.ack()
This pattern ensures that a request that enters via HTTP, publishes to Pub/Sub, and gets processed by a subscriber all share a single trace — giving you end-to-end visibility across the async boundary.
6) SLOs for Serverless: Business Flows, Not Functions
A common mistake with serverless observability is defining SLOs at the function level ("Cloud Run service X has 99.9% availability"). This misses the point — users don't care about individual function availability; they care about whether the business operation succeeded.
We define SLOs at the business flow level:
- Claim submission flow: Request received → validated → EDI generated → transmitted → acknowledged. SLO: 99.5% of claims submitted within 30 seconds end-to-end.
- Eligibility check flow: Request → 270 generated → payer response → 271 parsed → result returned. SLO: 95% of eligibility checks complete within 10 seconds.
To measure flow-level SLOs in a serverless architecture, each service emits a business outcome metric at the flow boundary:
from opentelemetry import metrics

meter = metrics.get_meter(__name__)
flow_counter = meter.create_counter(
    "business.flow.outcome",
    description="Business flow completion outcomes"
)

def complete_claim_submission(claim_id, success, duration_ms):
    flow_counter.add(1, {
        "flow": "claim_submission",
        "outcome": "success" if success else "failure",
        "duration_bucket": bucket(duration_ms, [1000, 5000, 15000, 30000]),
    })
This metric, combined with trace-based sampling of failures, gives you both the SLO dashboard view and the diagnostic depth to investigate when the SLO burns down.
7) Cold Start Impact on Traces
Cloud Run cold starts add latency to the first request after scaling from zero. This latency shows up in traces but shouldn't count against your application SLOs. We handle this by:
- Adding a
cloud_run.cold_start: truespan attribute on the first request after initialization - Filtering cold-start spans from SLO calculations while keeping them visible in trace views
- Monitoring cold start frequency as a separate SLI — too many cold starts indicate a min-instances misconfiguration
Minimal Collector for Cloud Run
receivers:
  otlp:
    protocols:
      http:

processors:
  batch:
    send_batch_size: 512
    timeout: 5s
  resourcedetection:
    detectors: [gcp, env]
  resource:
    attributes:
      - key: deployment.environment
        value: "${ENVIRONMENT}"
        action: upsert
      - key: team
        value: "${TEAM}"
        action: upsert

exporters:
  googlecloud:
    retry_on_failure:
      enabled: true
    sending_queue:
      enabled: true
      num_consumers: 2

service:
  pipelines:
    traces: { receivers: [otlp], processors: [resourcedetection, resource, batch], exporters: [googlecloud] }
    metrics: { receivers: [otlp], processors: [resourcedetection, resource, batch], exporters: [googlecloud] }
The collector runs as a sidecar in Cloud Run (using multi-container support) or as a shared service behind an internal load balancer. For low-volume services, the sidecar approach adds ~50MB memory overhead but eliminates network hops. For high-volume services, a shared collector with connection pooling is more efficient.
For the full observability framework and cost optimization strategies, see Comprehensive Observability on GCP and Cost-Optimized Telemetry Management.